Video: View customer monitoring insights
Last updated: April 7, 2026
In this guide, you will learn how to access and analyze customer monitoring insights in Mesh.
When logging in to your account, please ensure you select the correct region, which will be one of the following:
Australia: https://au.mesh.complyadvantage.com/
You can find the link to your region in the onboarding email you received (look for the "Welcome to ComplyAdvantage" email).
If you can’t find the email, don't worry! You can always contact our support team at [email protected].
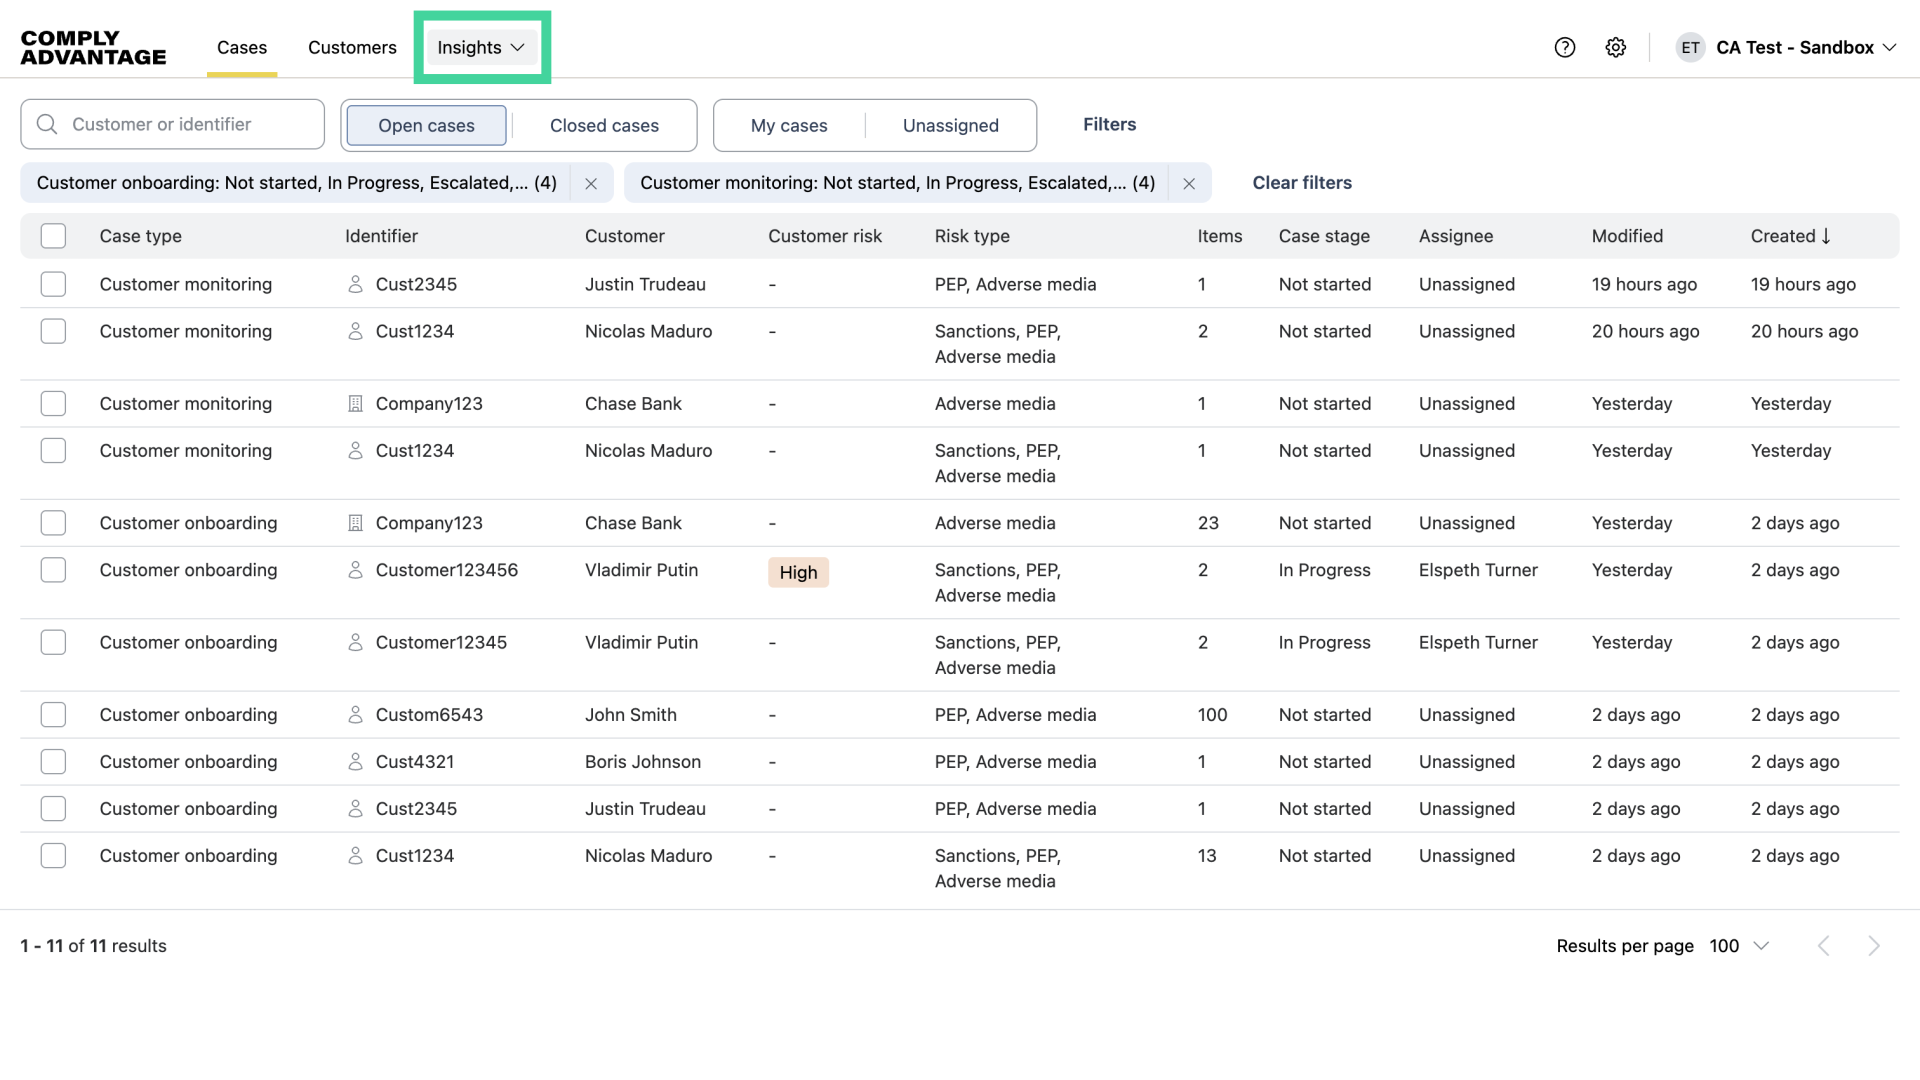
1. Click "Insights"
First, click "Insights."
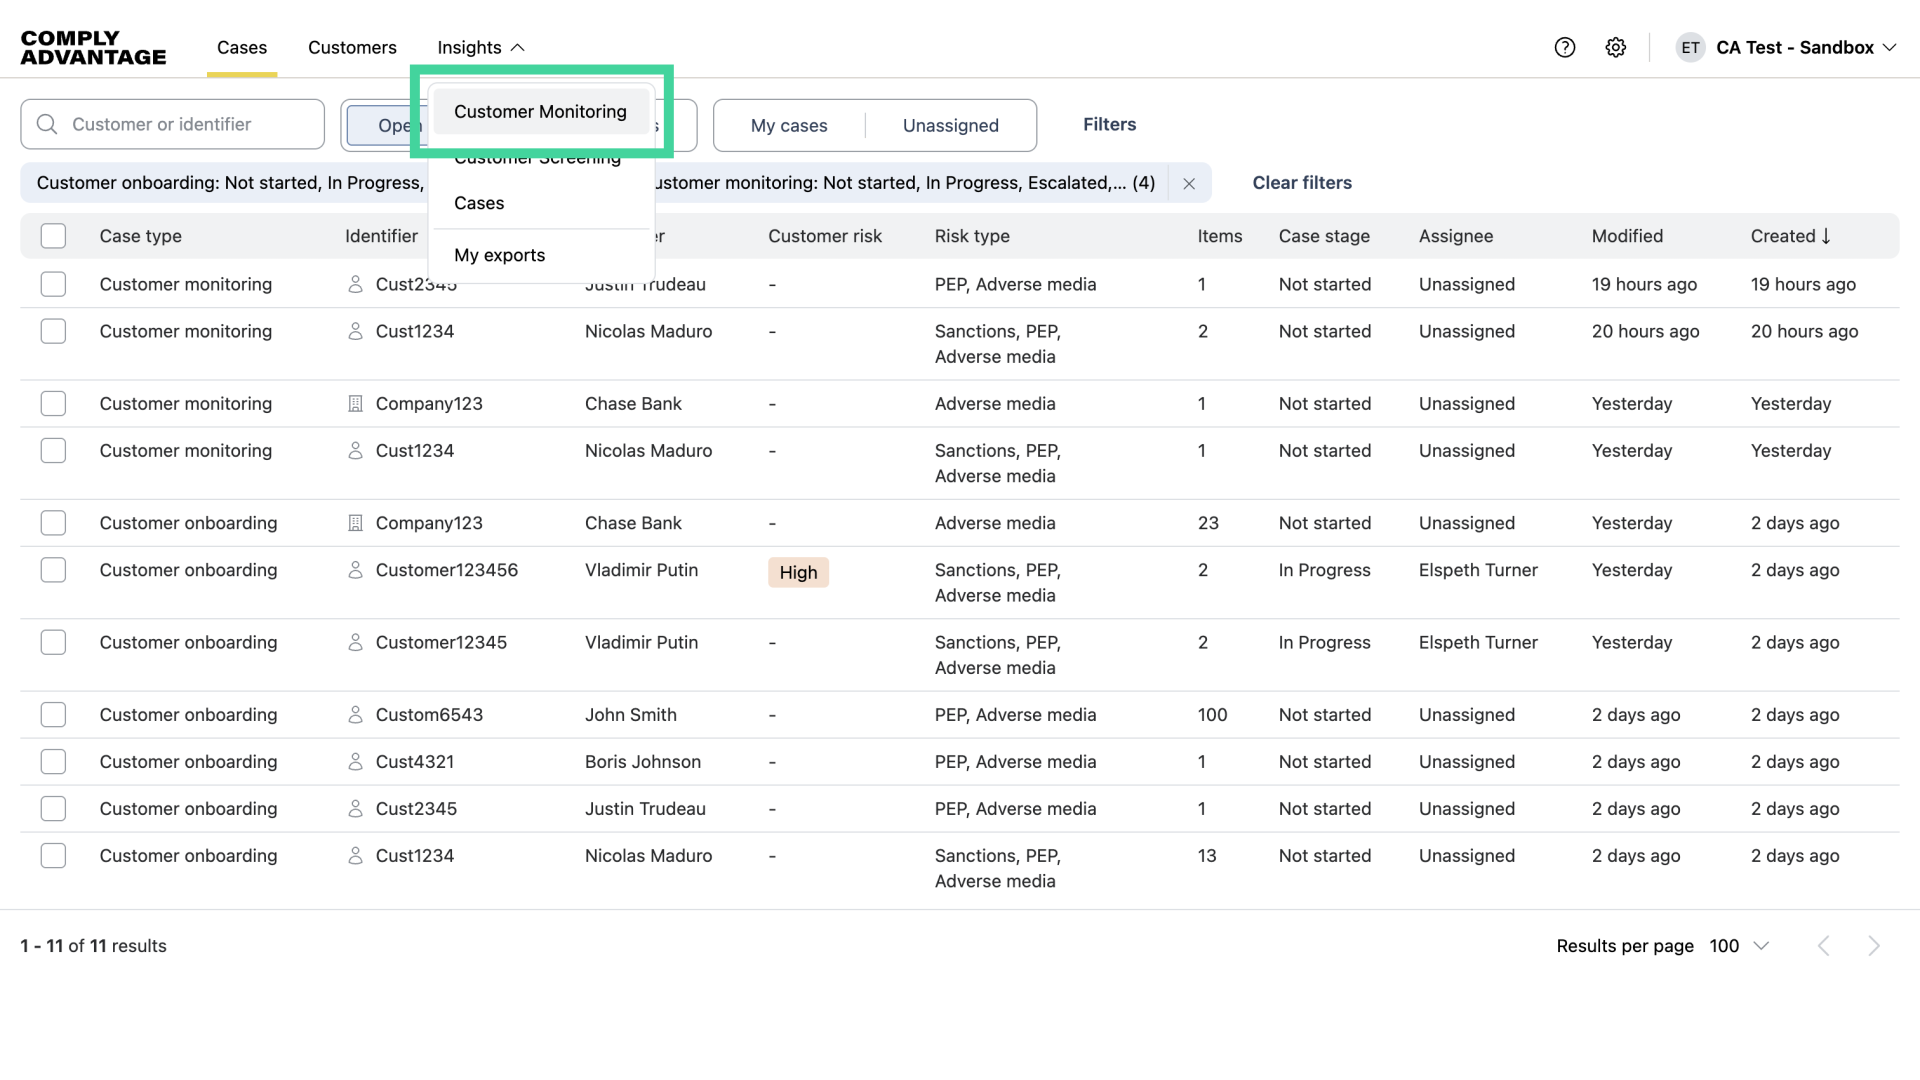
2. Click "Customer Monitoring"
Then, navigate to the customer monitoring section.
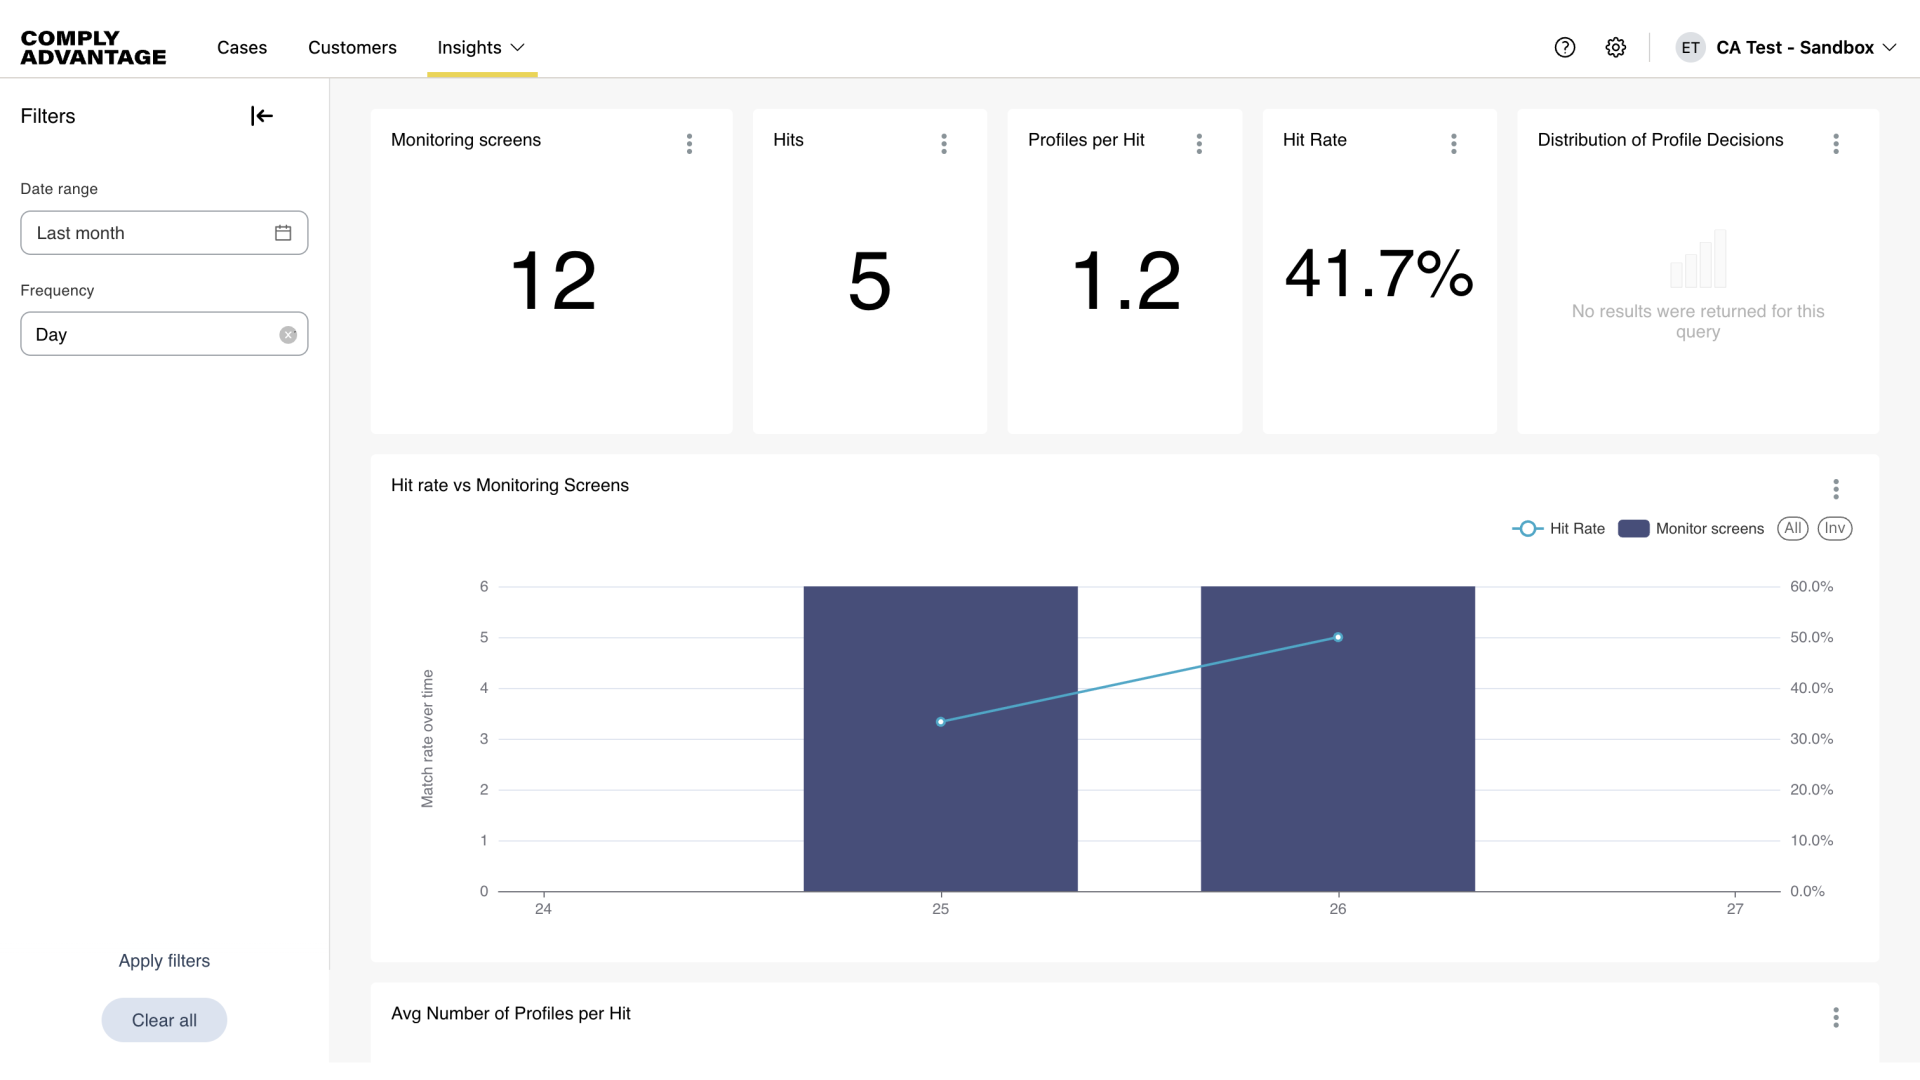
3. Monitoring Dashboard
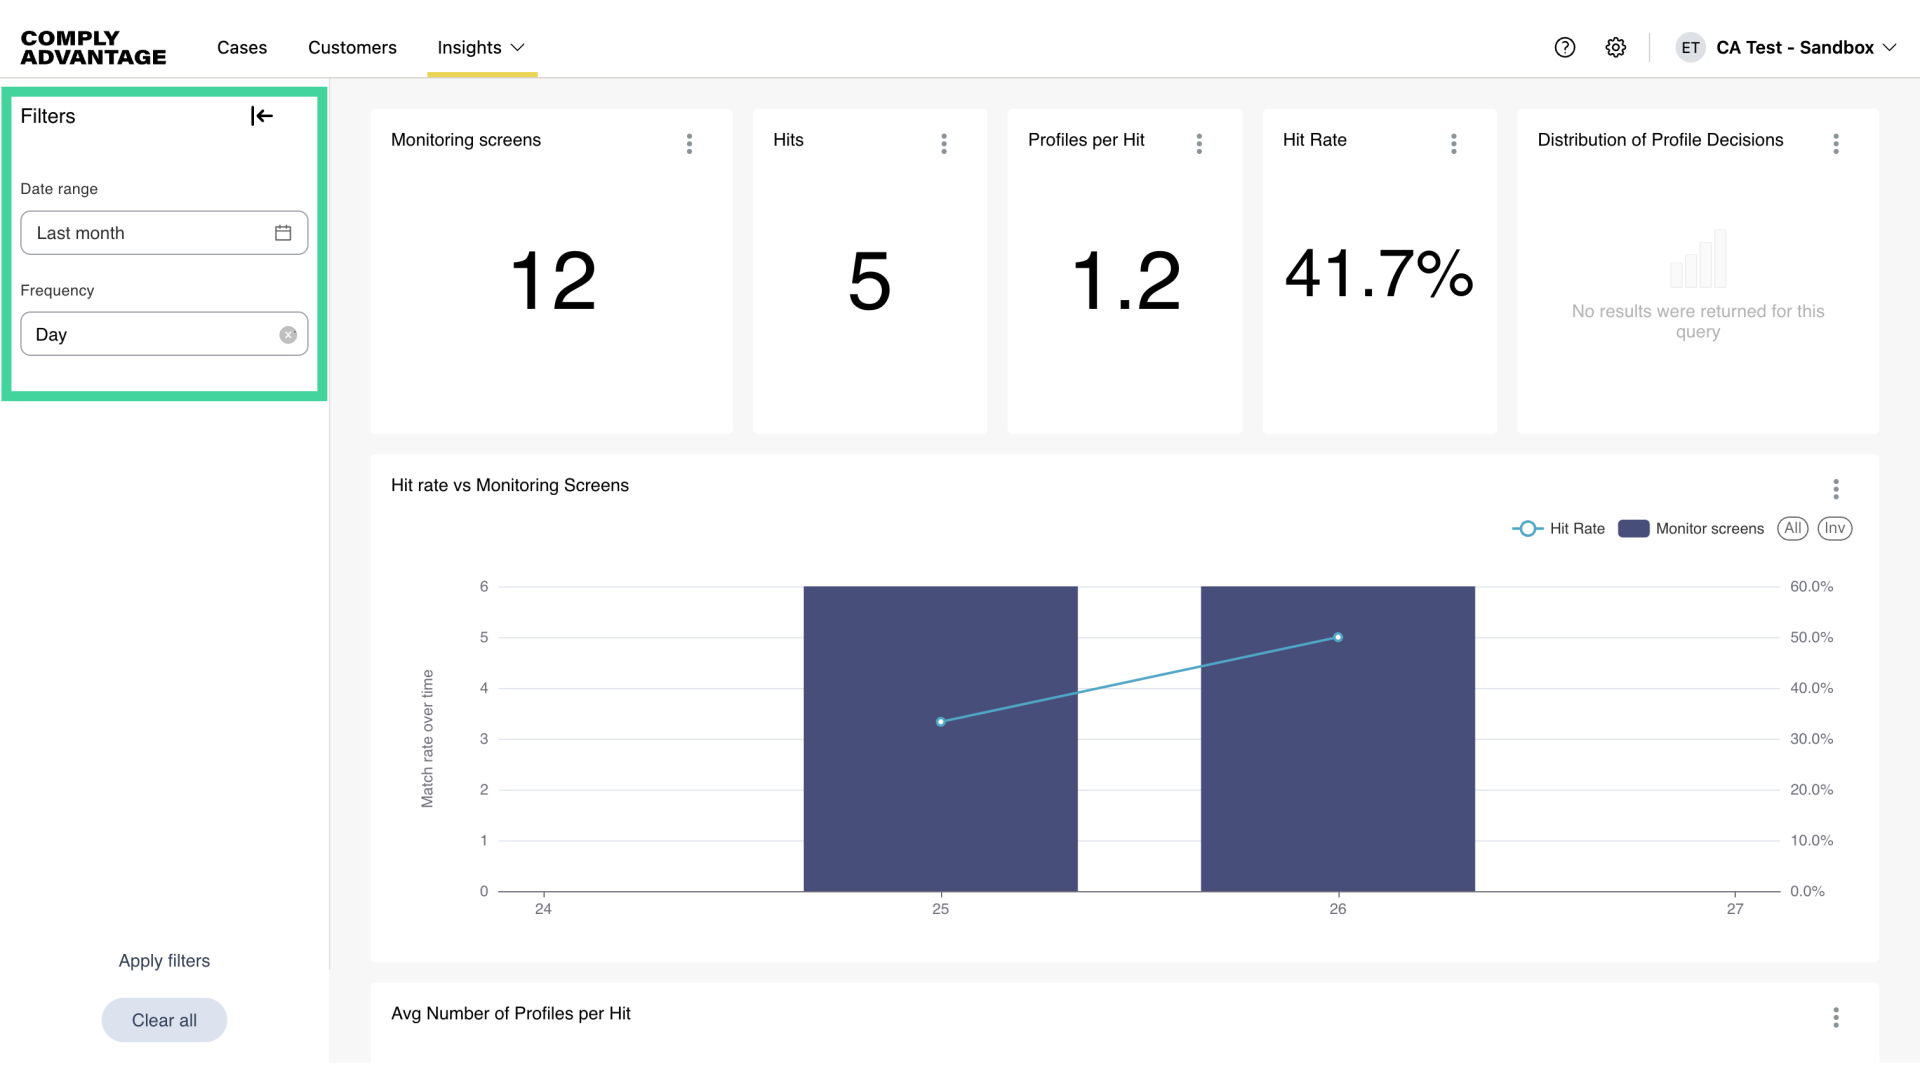
The top of the Customer Monitoring dashboard highlights key data points for a default date range of the last 30 days. The headline metrics include the following:
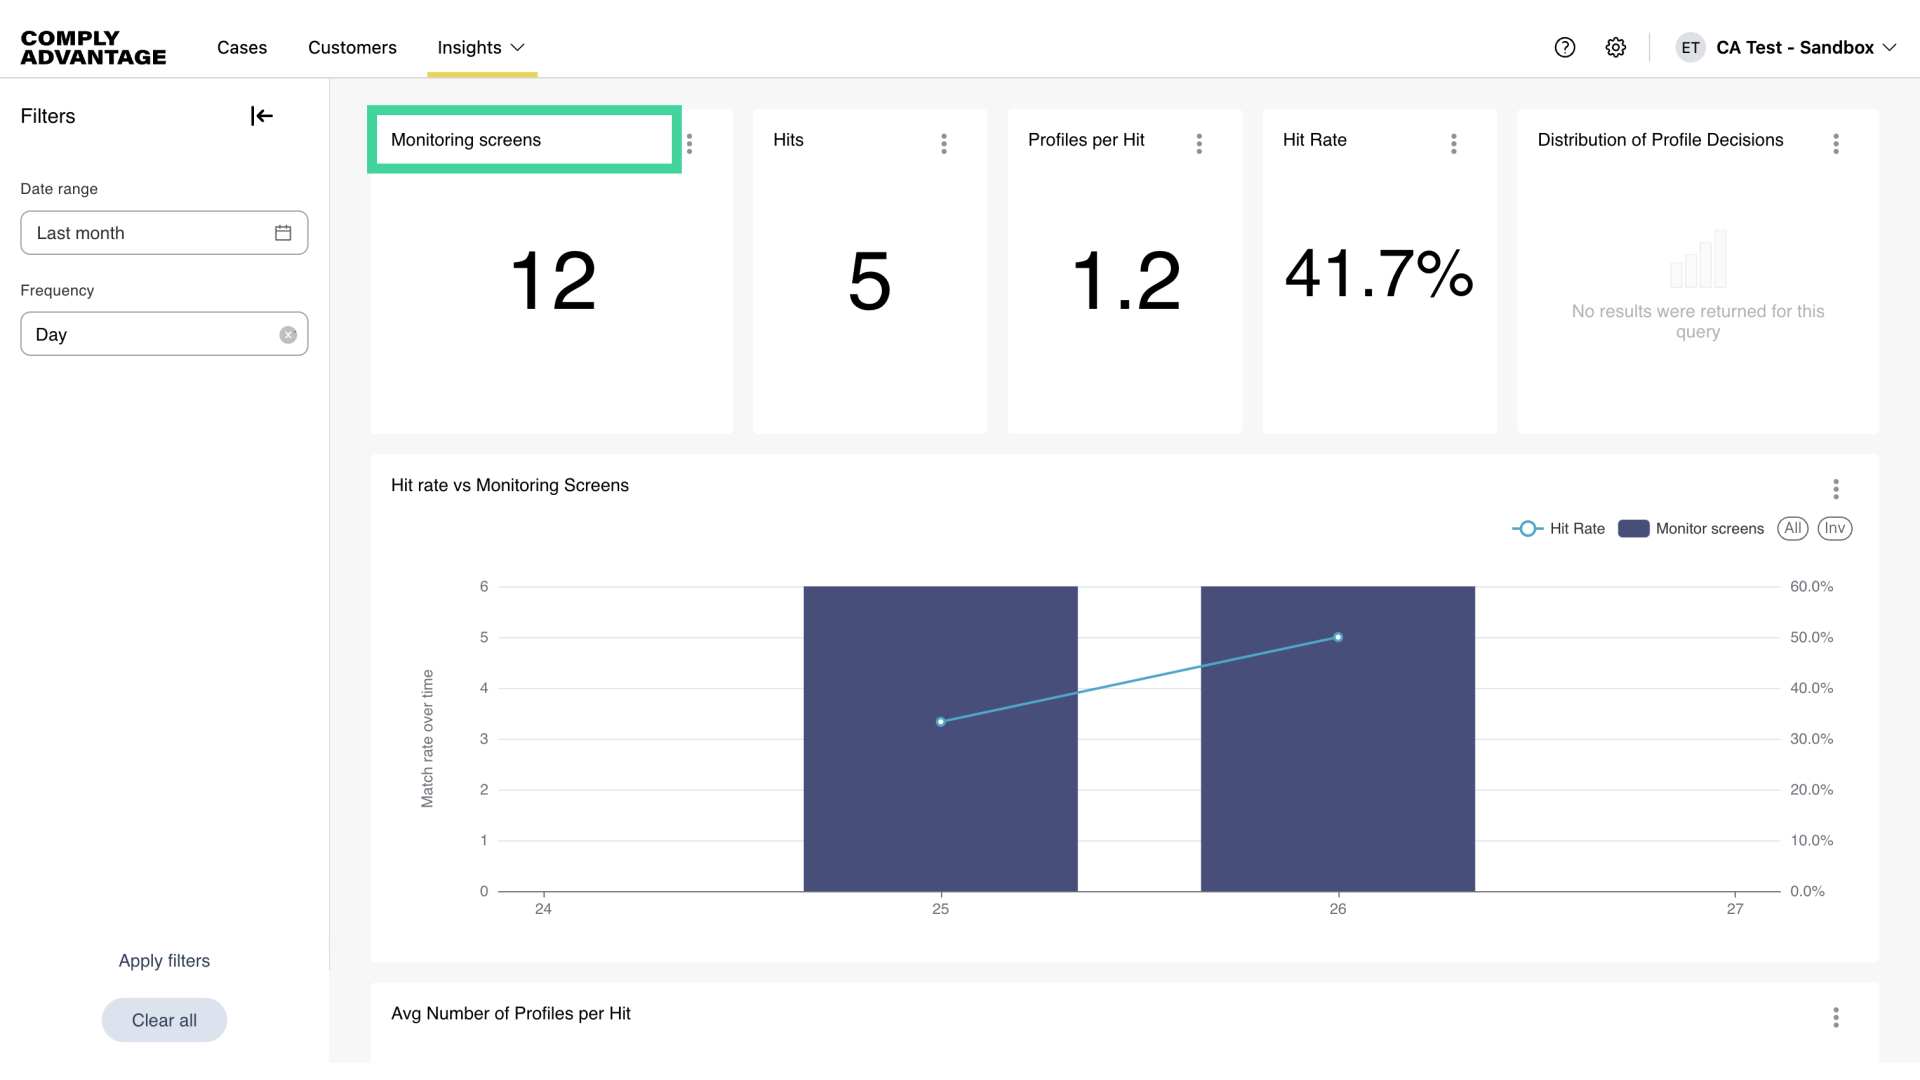
4. Monitoring screens
Monitoring Screens. This is the number of times monitored customers were re-screened during this period.
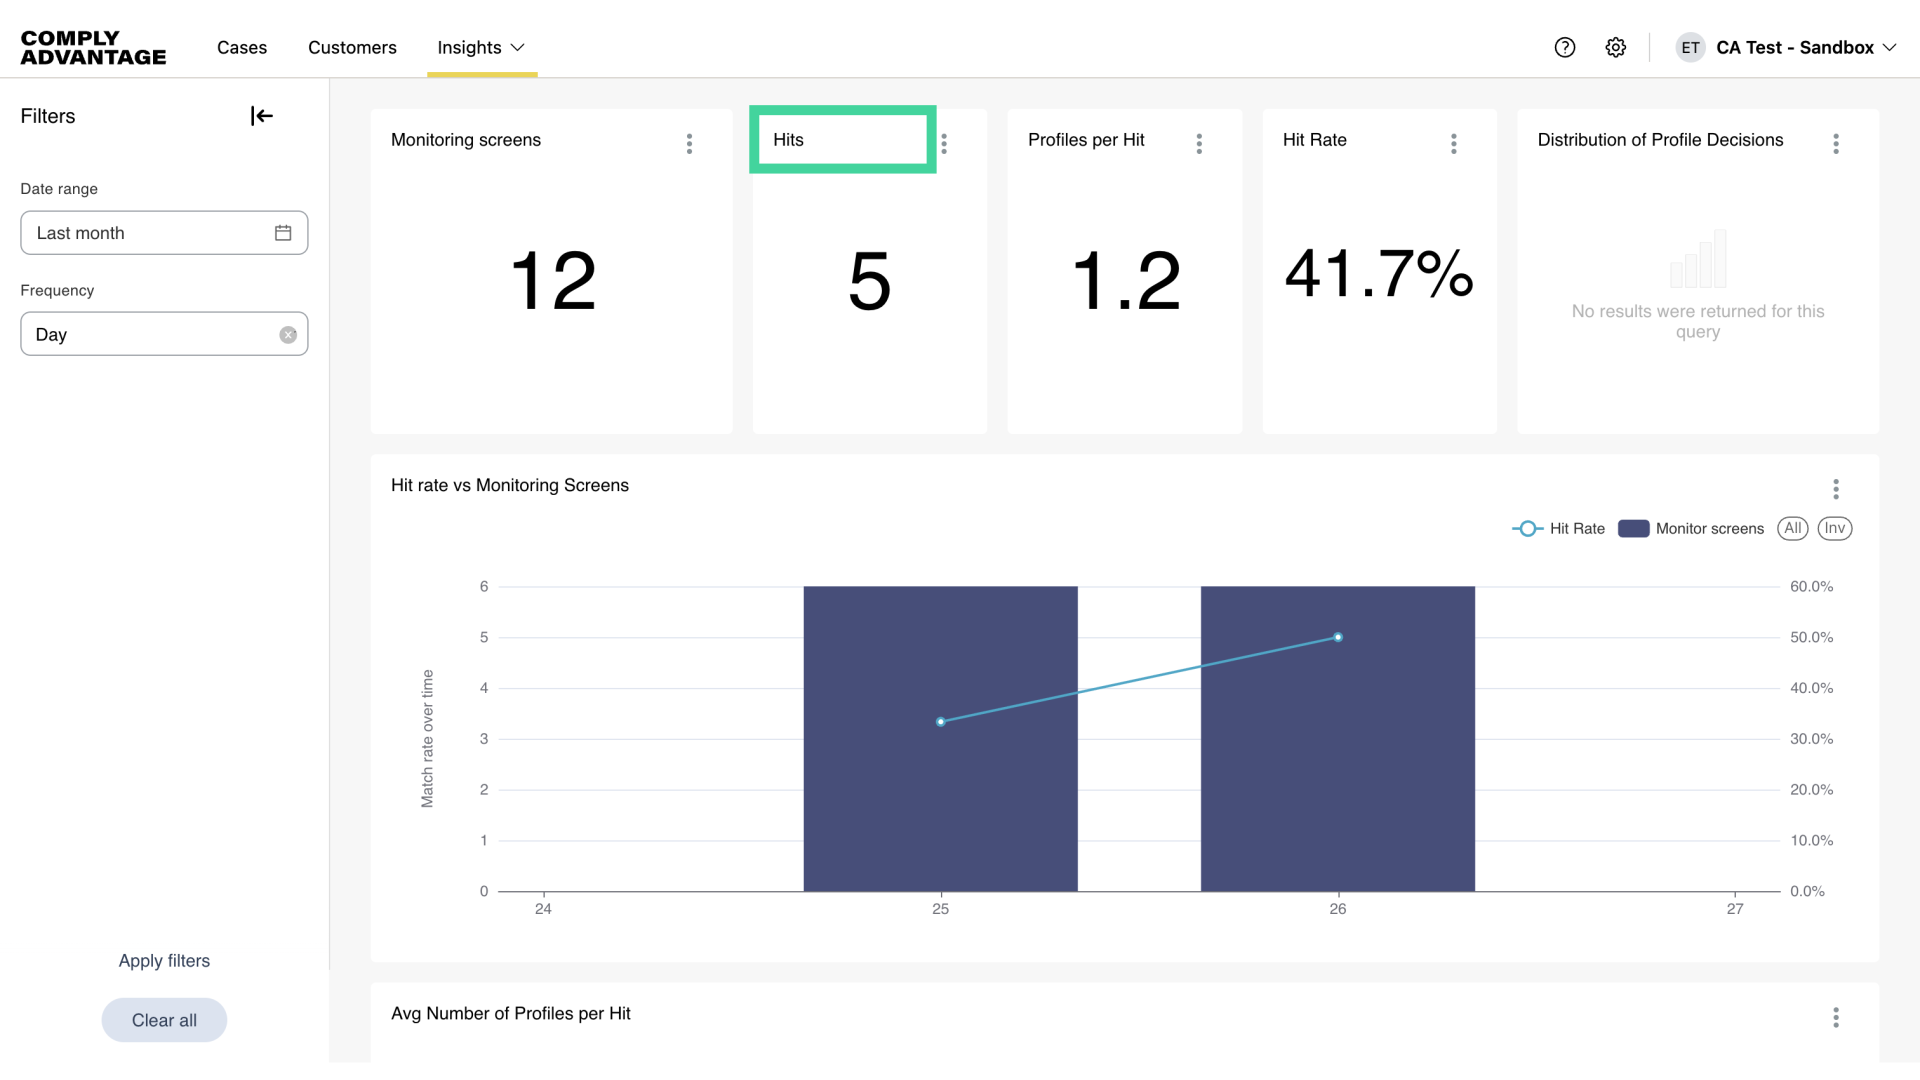
5. Hits
Hits refer to the proportion of monitored customers that returned profiles during monitoring.
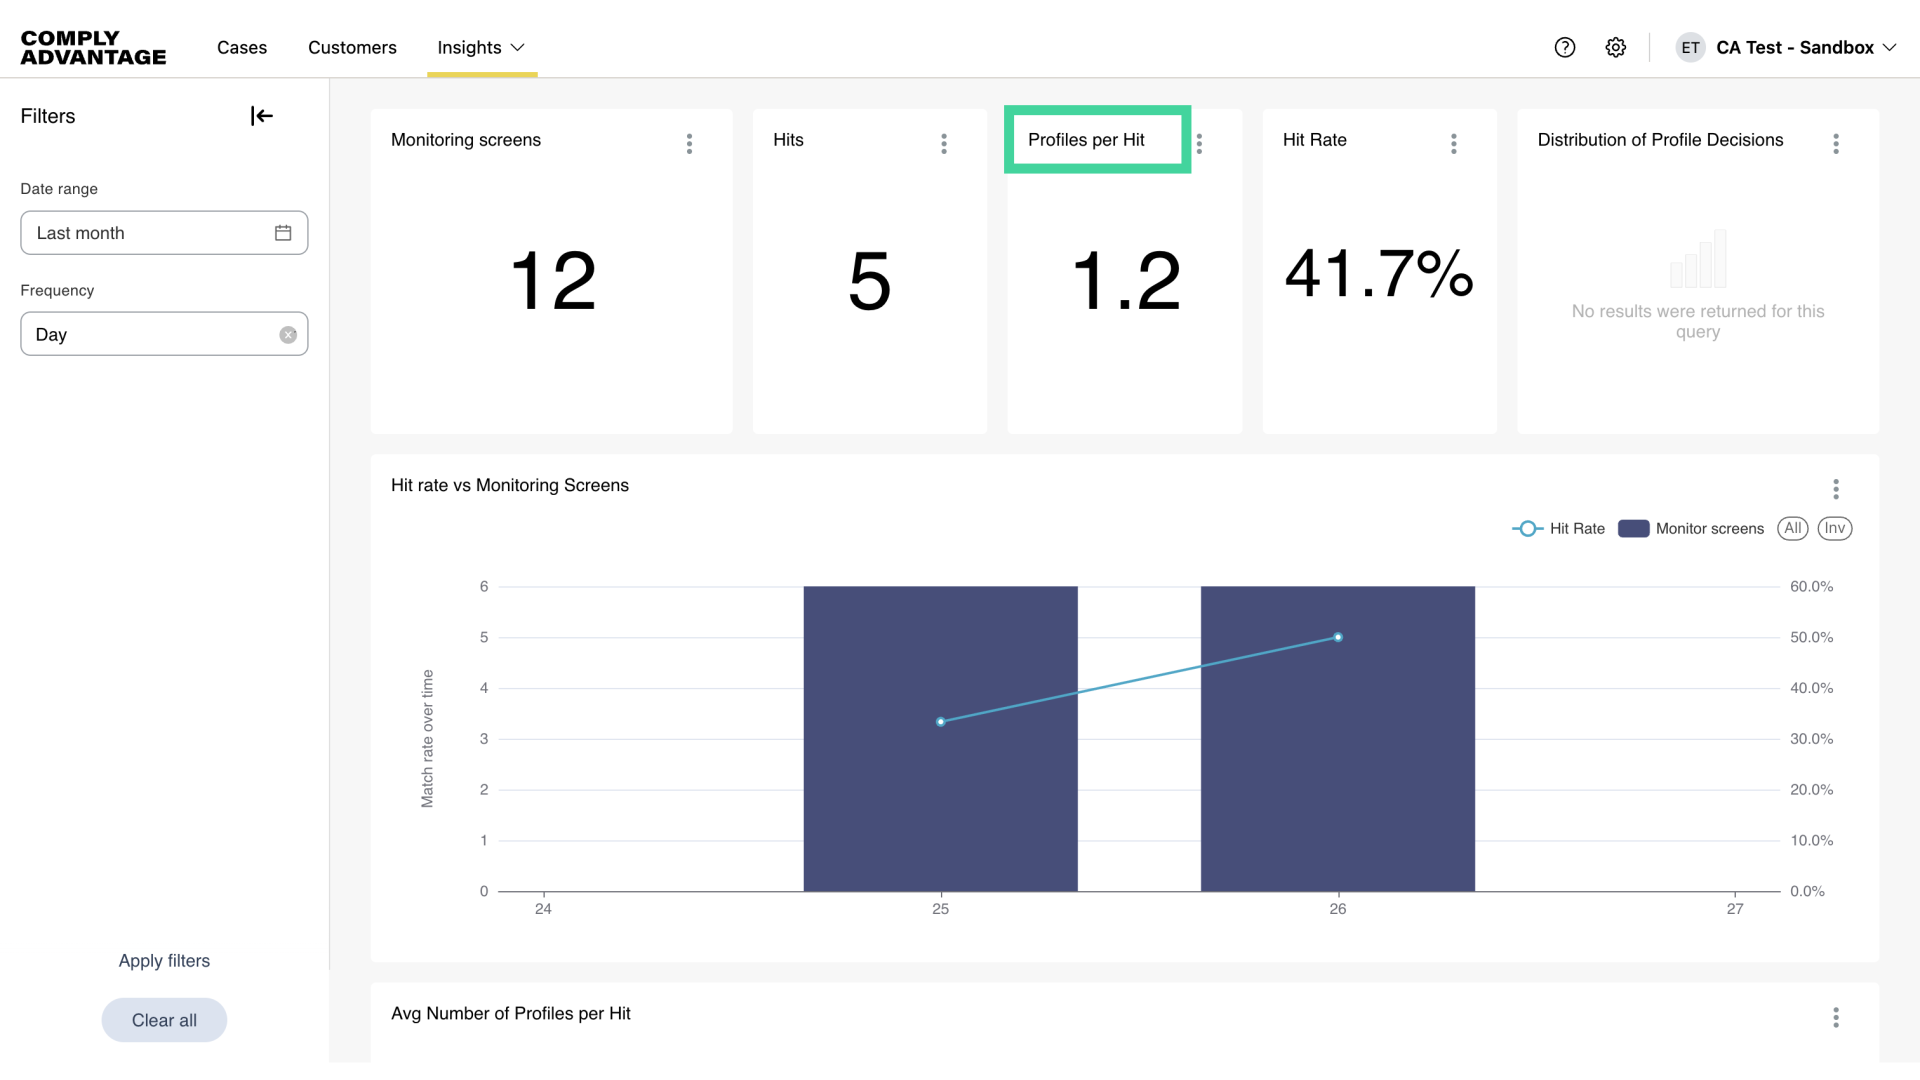
6. Profiles per Hit
Profiles per Hit refers to the average number of profiles associated with each hit.
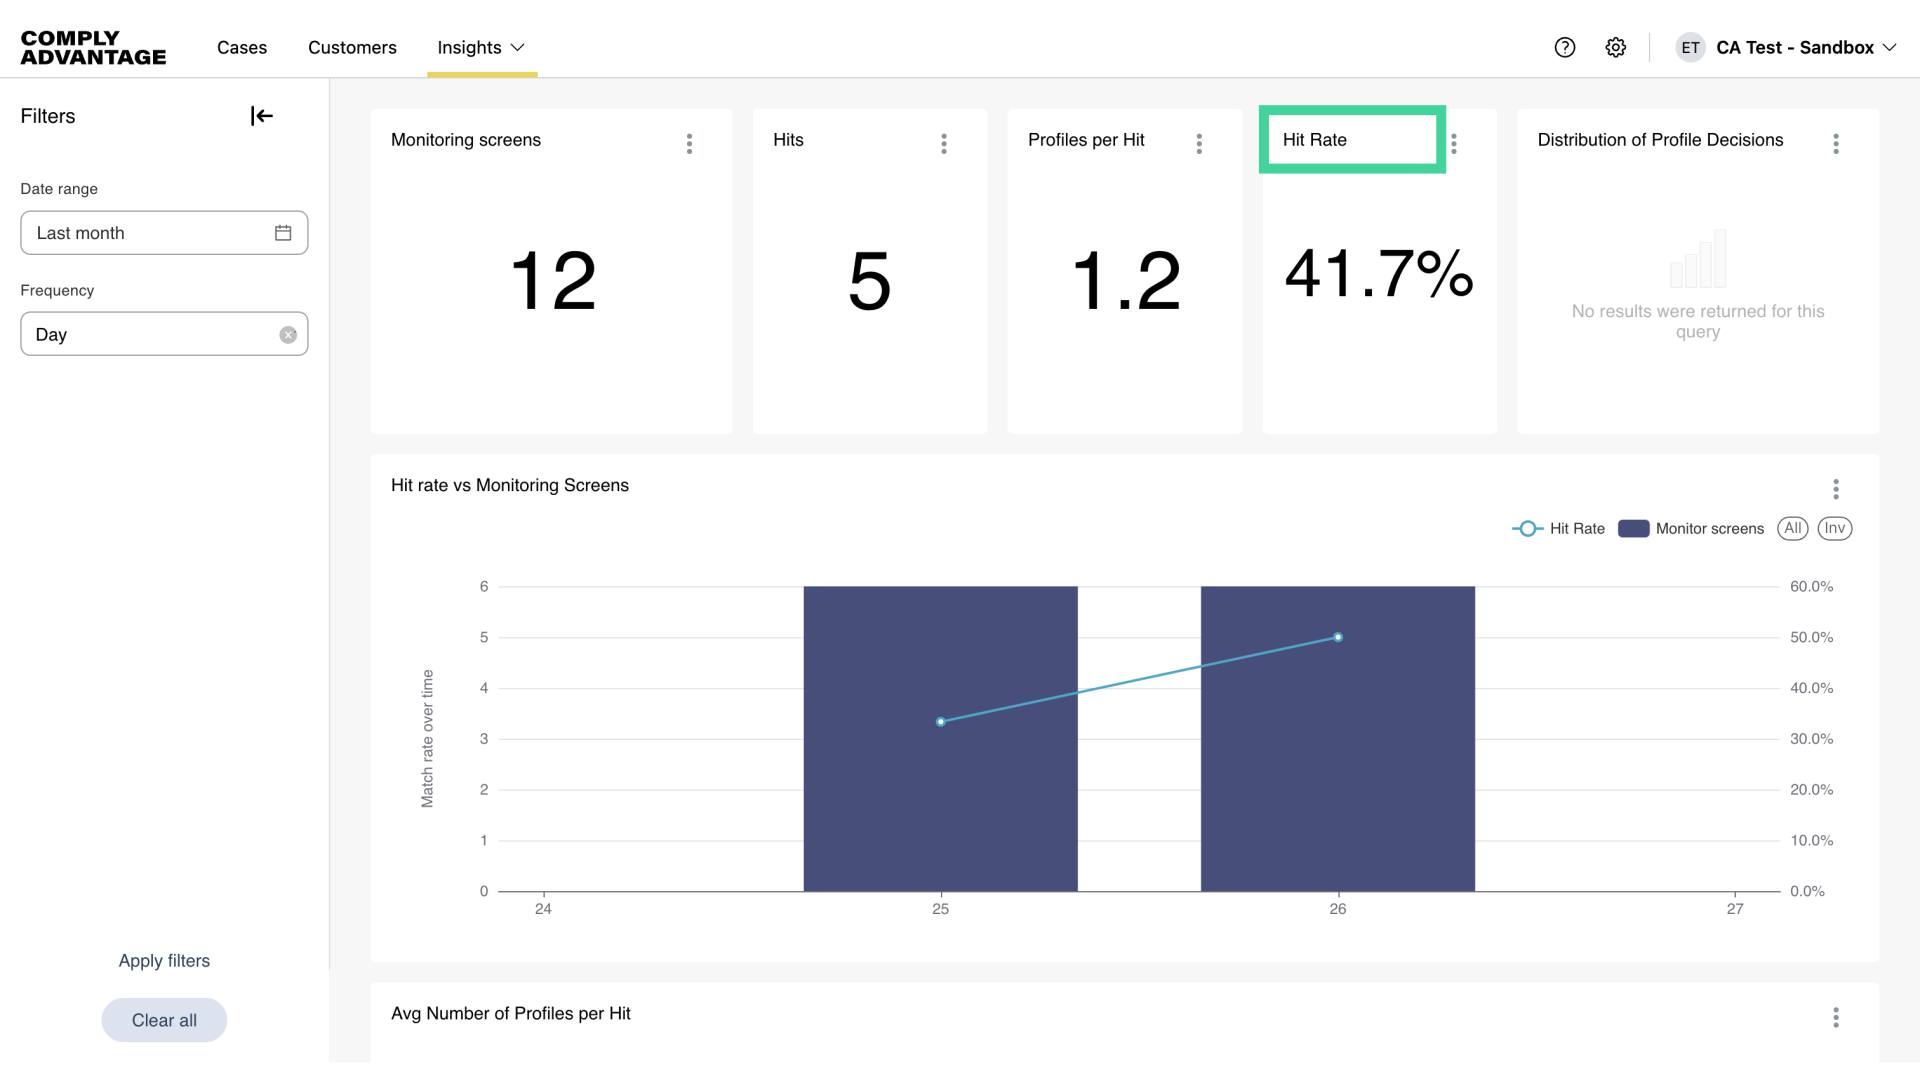
7. Hit Rate
Hit Rate refers to the proportion of customers monitored that had a hit.
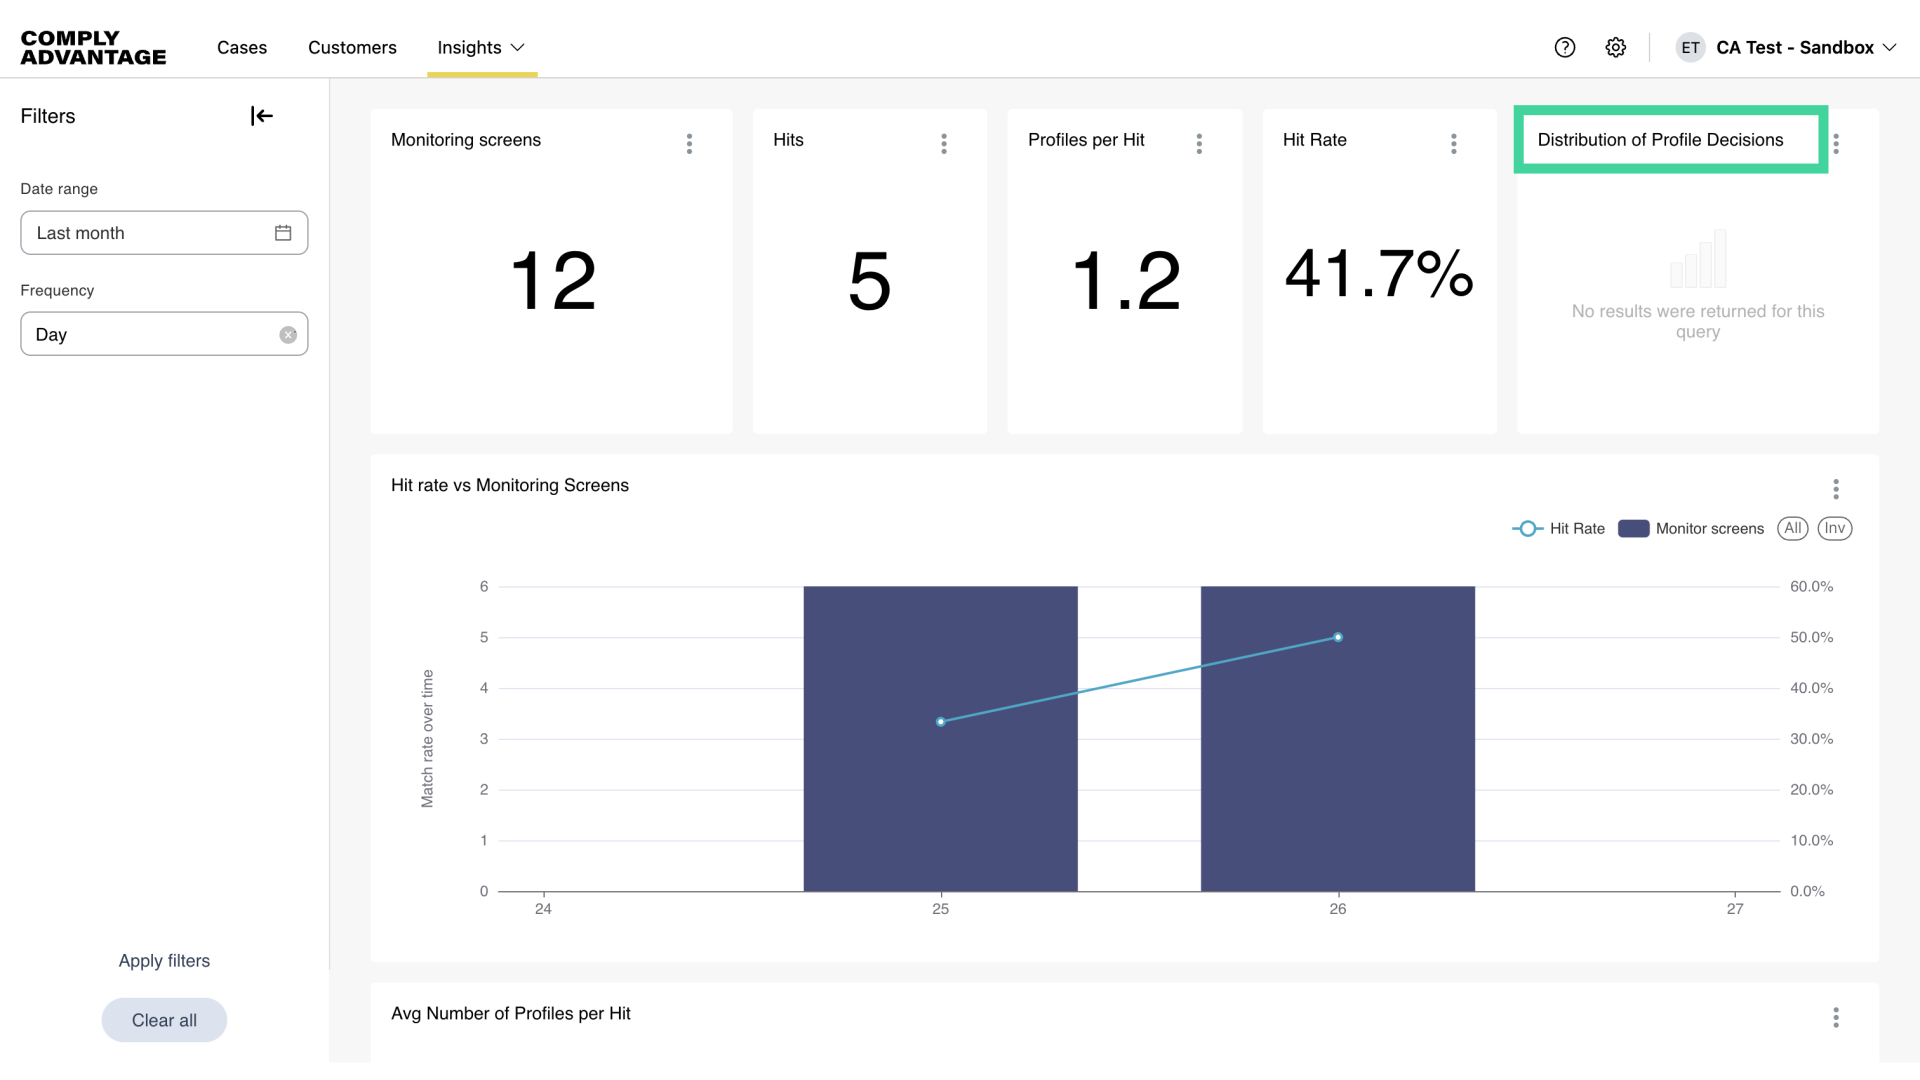
8. Distribution of Profile Decisions
And Distribution of profile decisions refers to the proportion of true positive vs. false positive matches.
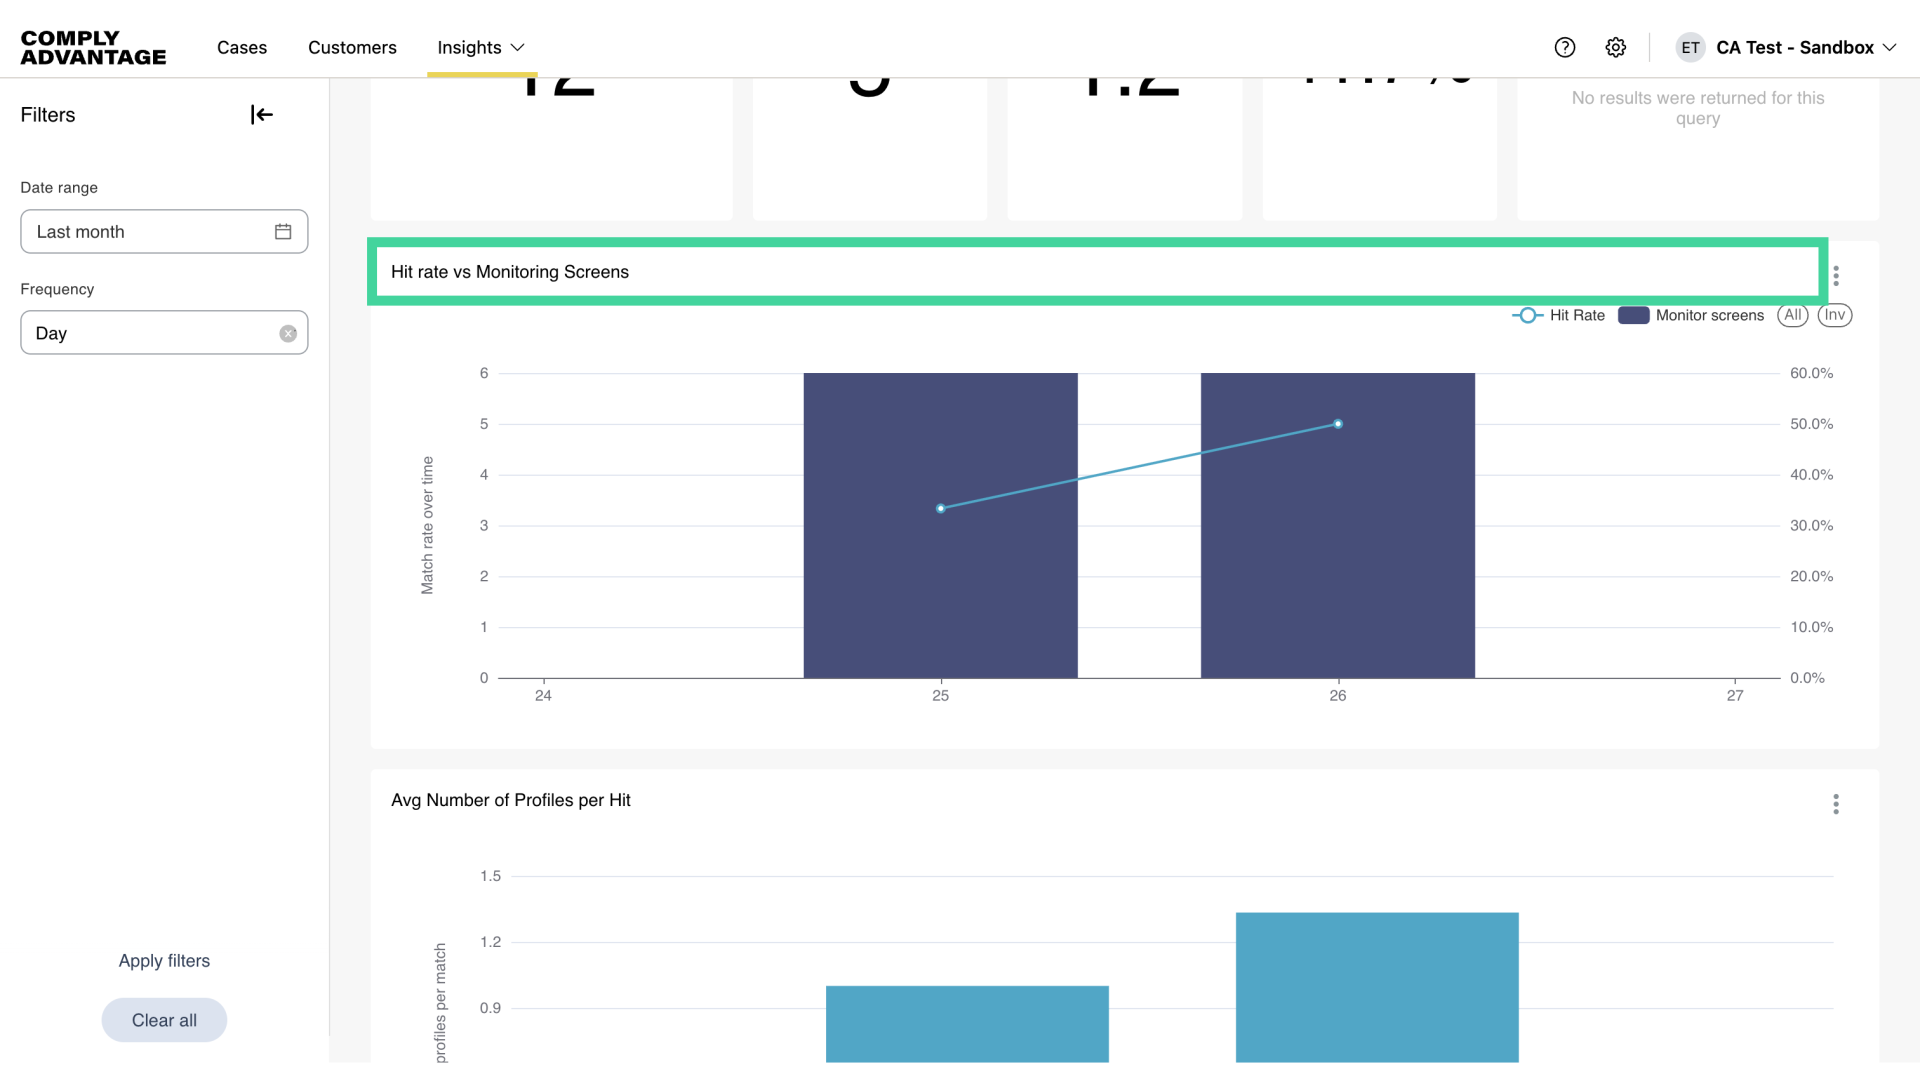
9. Hit rate vs Monitoring Screens
Moving onto the chart section, we have the Hit rate vs. number of monitoring screens. This chart shows the number of customers monitored for a given period and the average hit rate across all monitoring screens.
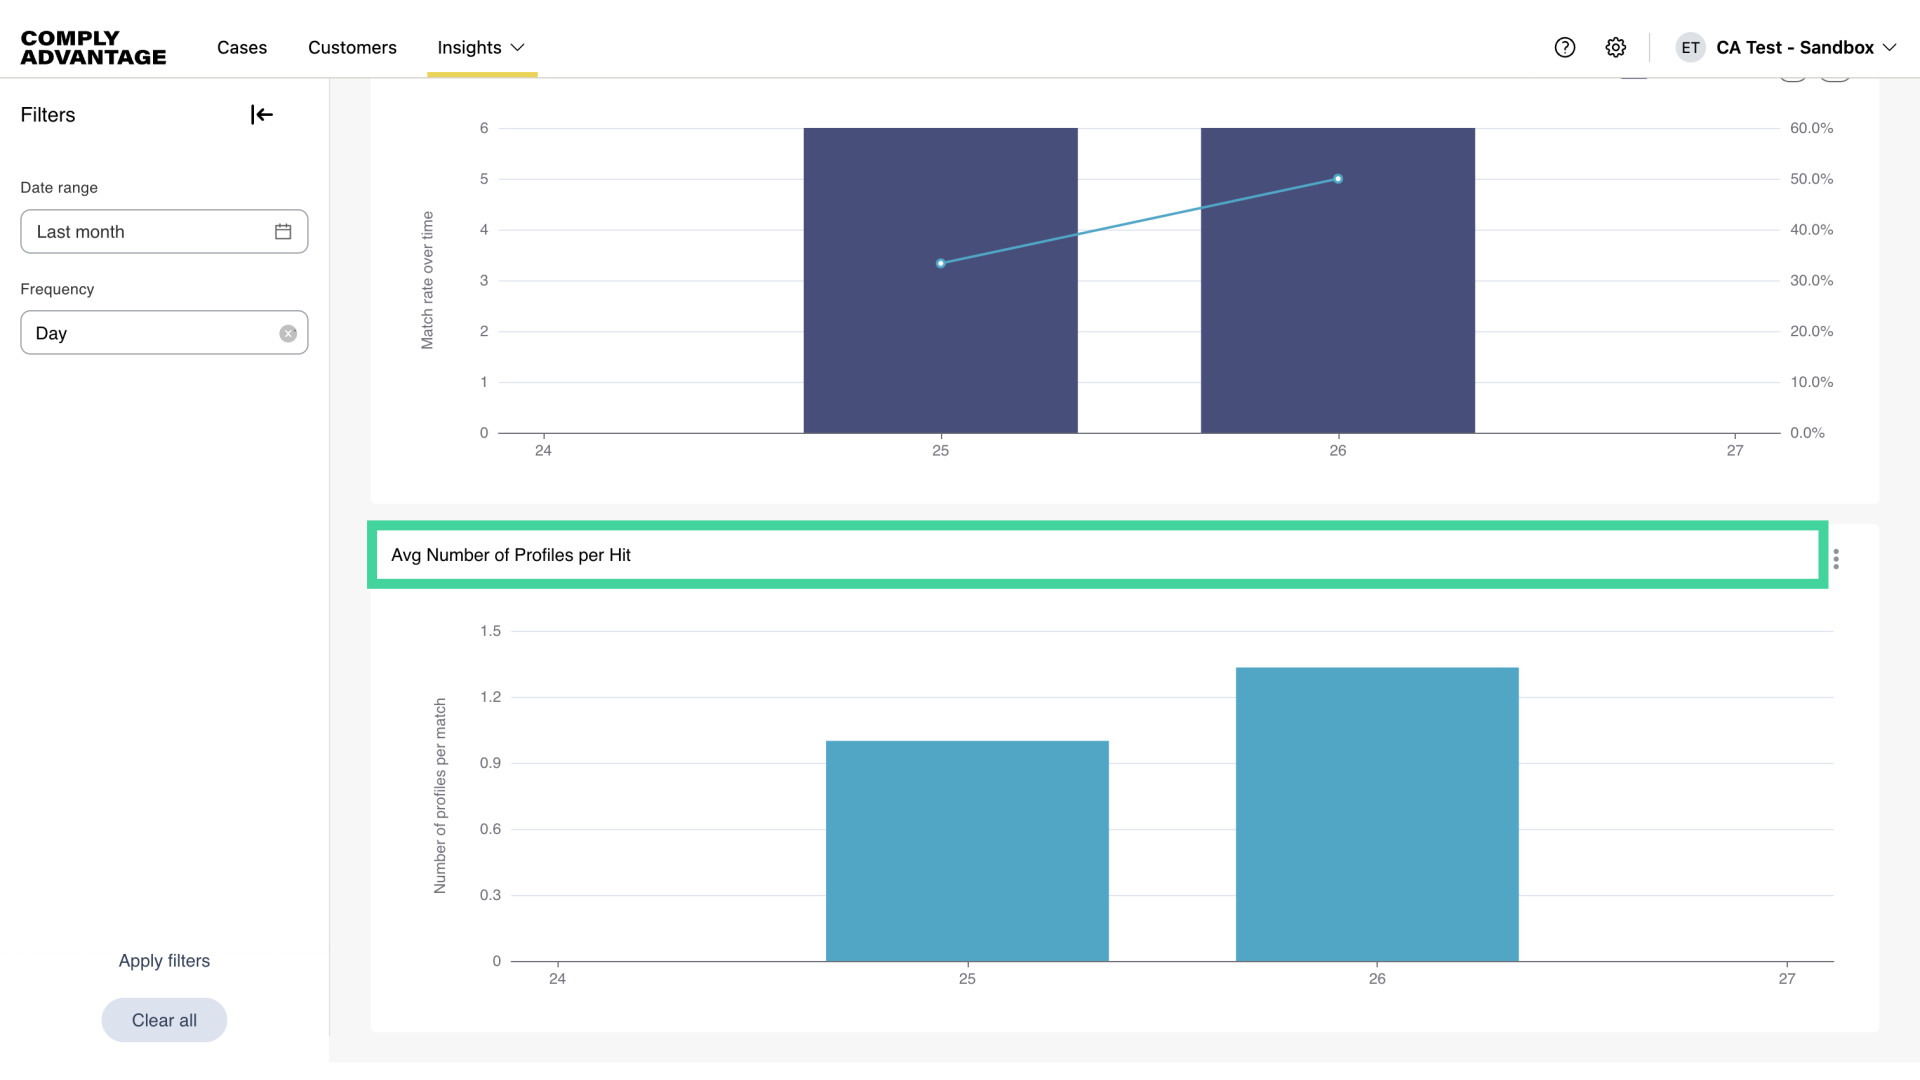
10. Average Number of Profiles per Hit
This next chart shows the average number of profiles returned for hits within a given period of time. This can be useful to understand if you’re getting too many or too few profiles returned each time there is a hit and if any adjustments need to be made to monitor settings.
11. Filters
As previously mentioned, the default date range is the last 30 days, and the default frequency is daily. However, you have the ability to change the date range to filter the data to focus on your preferred time frame.
12. Click here
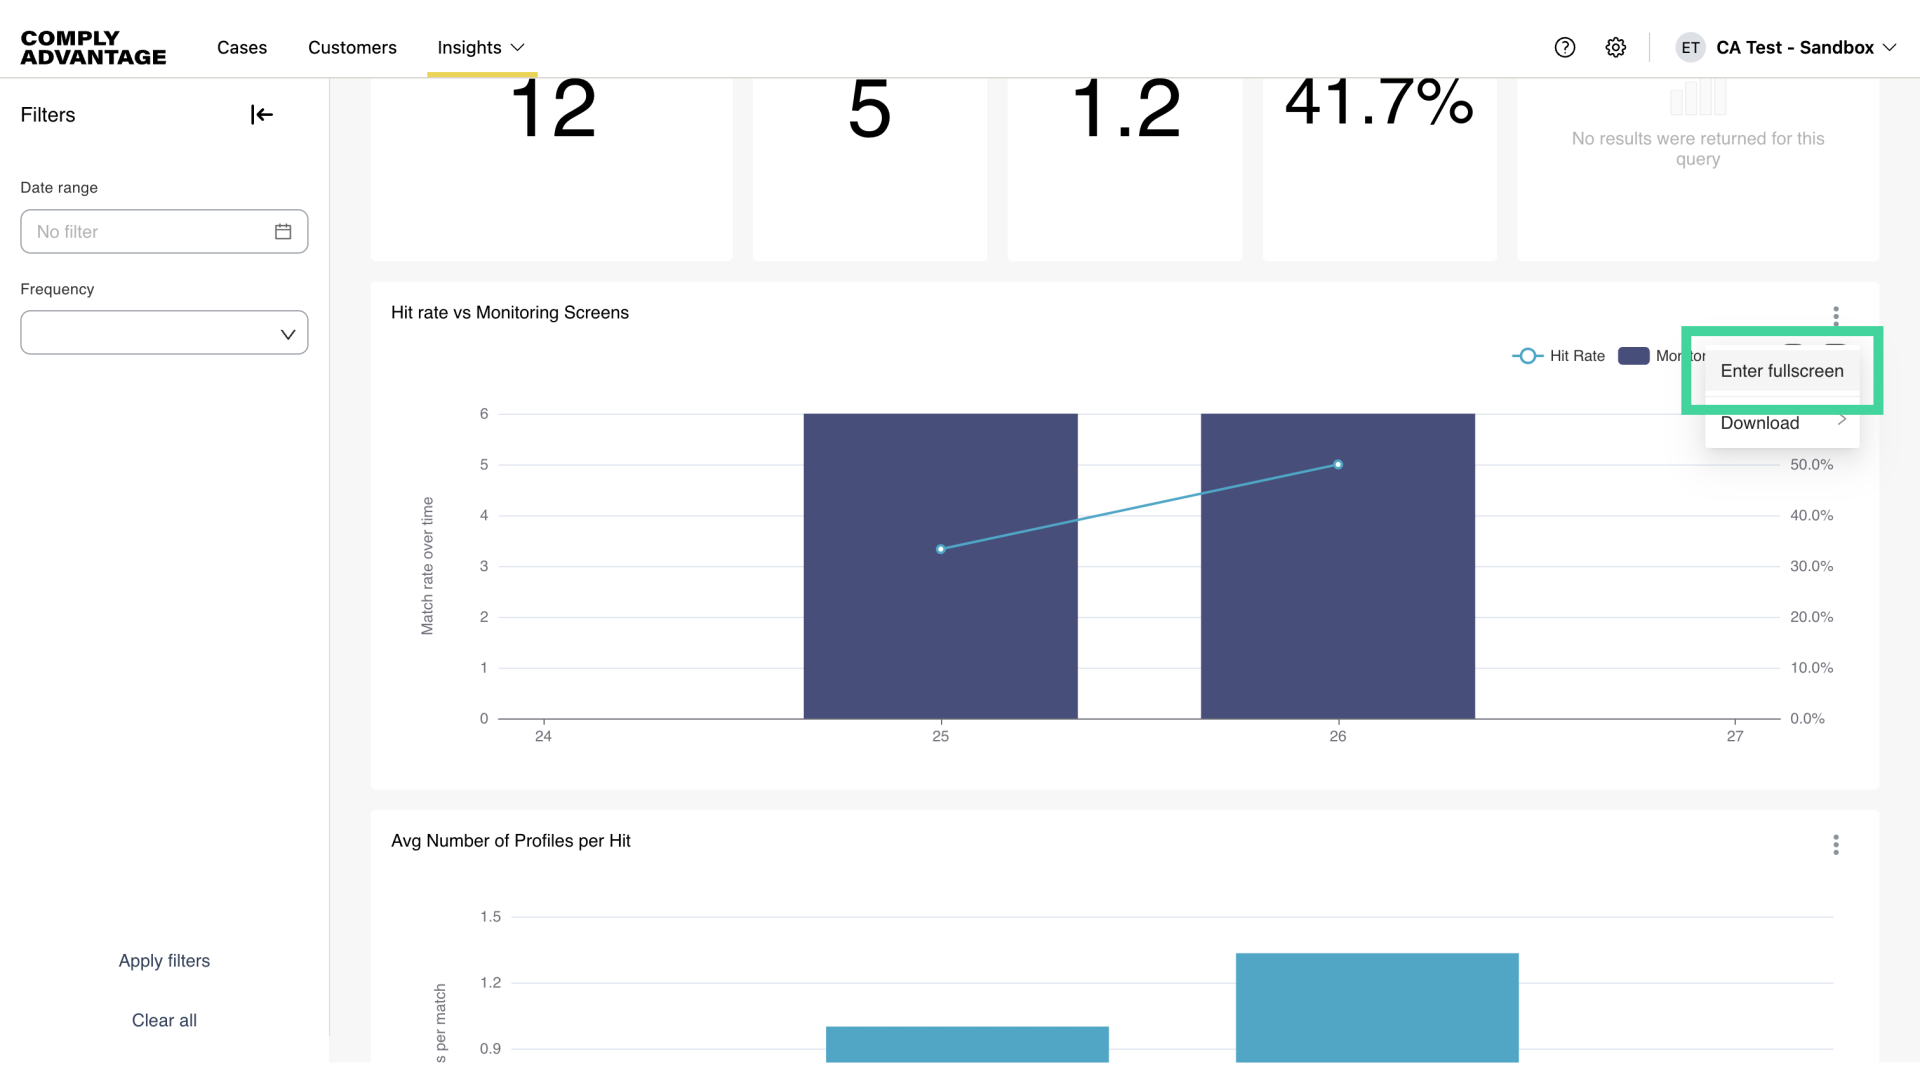
You also have the option to view the charts in a larger format for better visibility.
13. Click "Enter fullscreen"
Click here to "Enter fullscreen" mode.
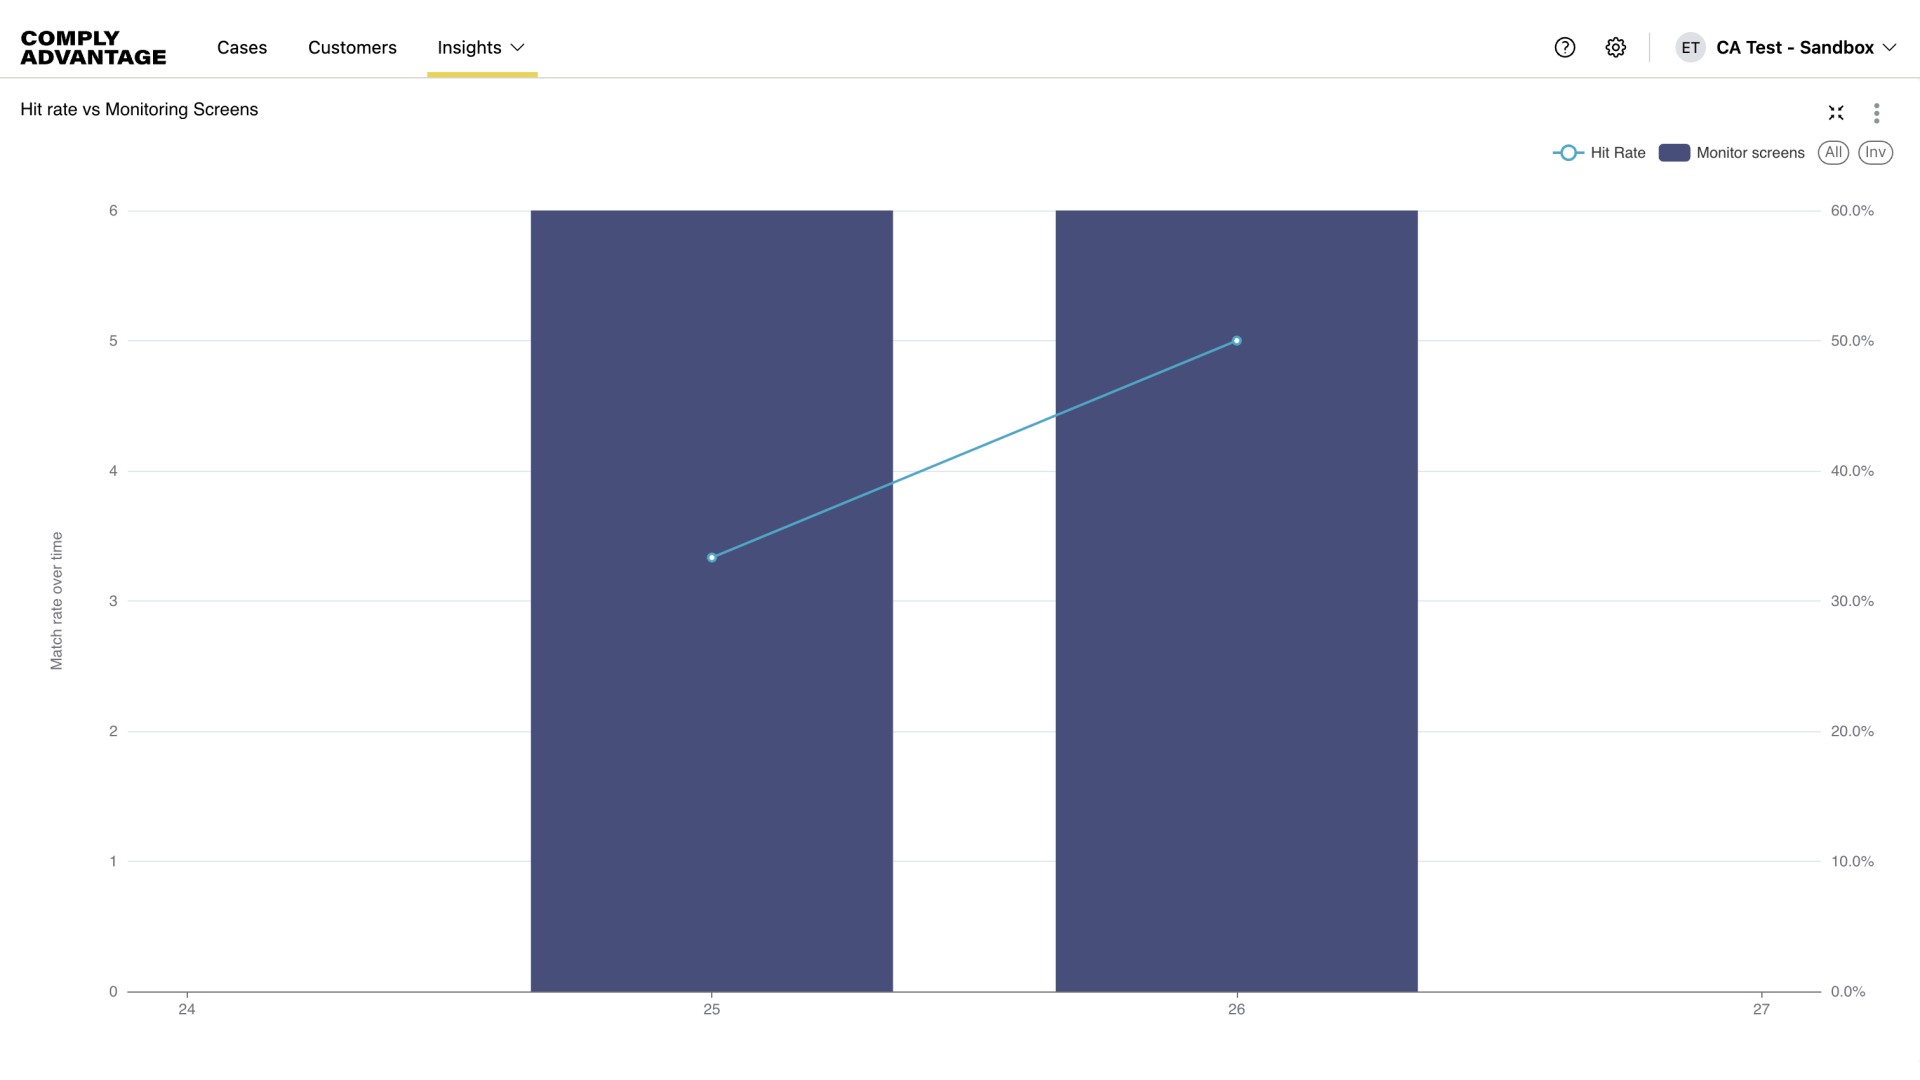
14. Full screen
You can now view the charts in an expanded format.
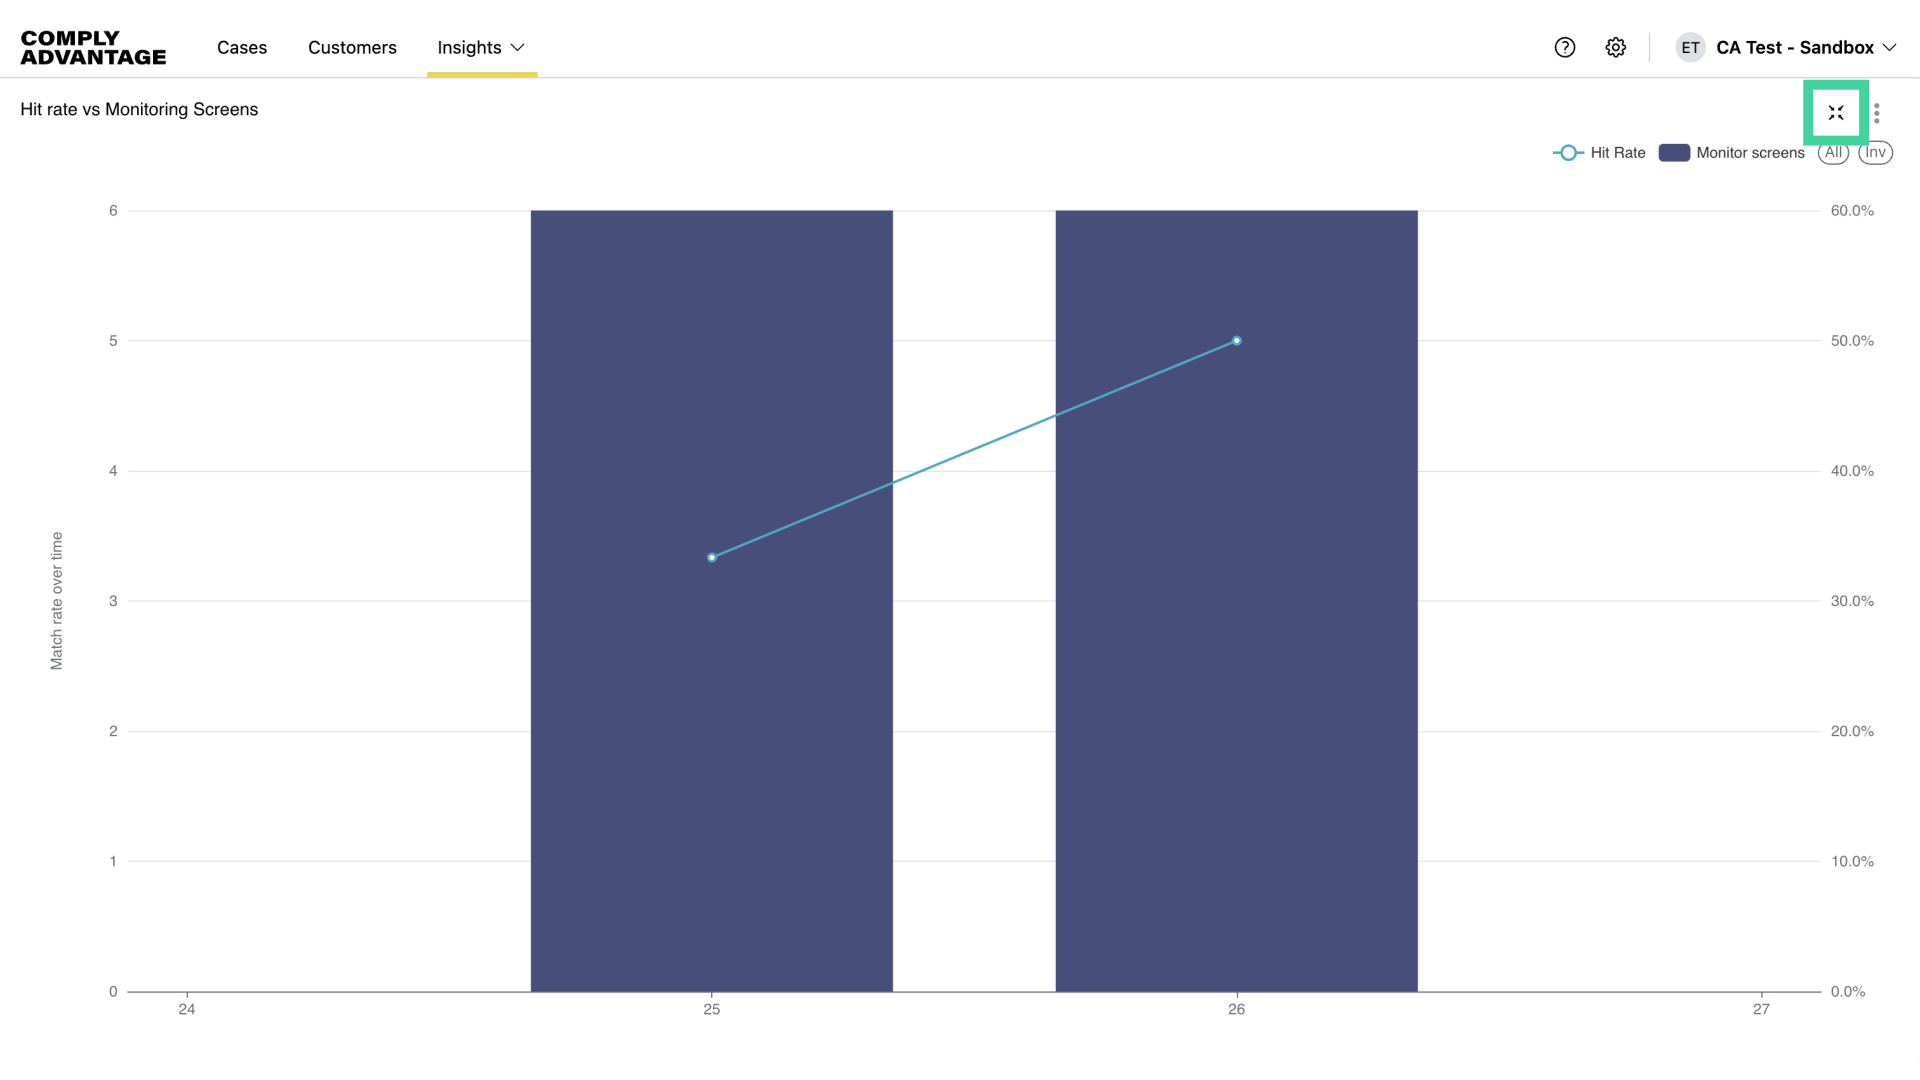
15. Exit full screen
To exit full-screen, click here.
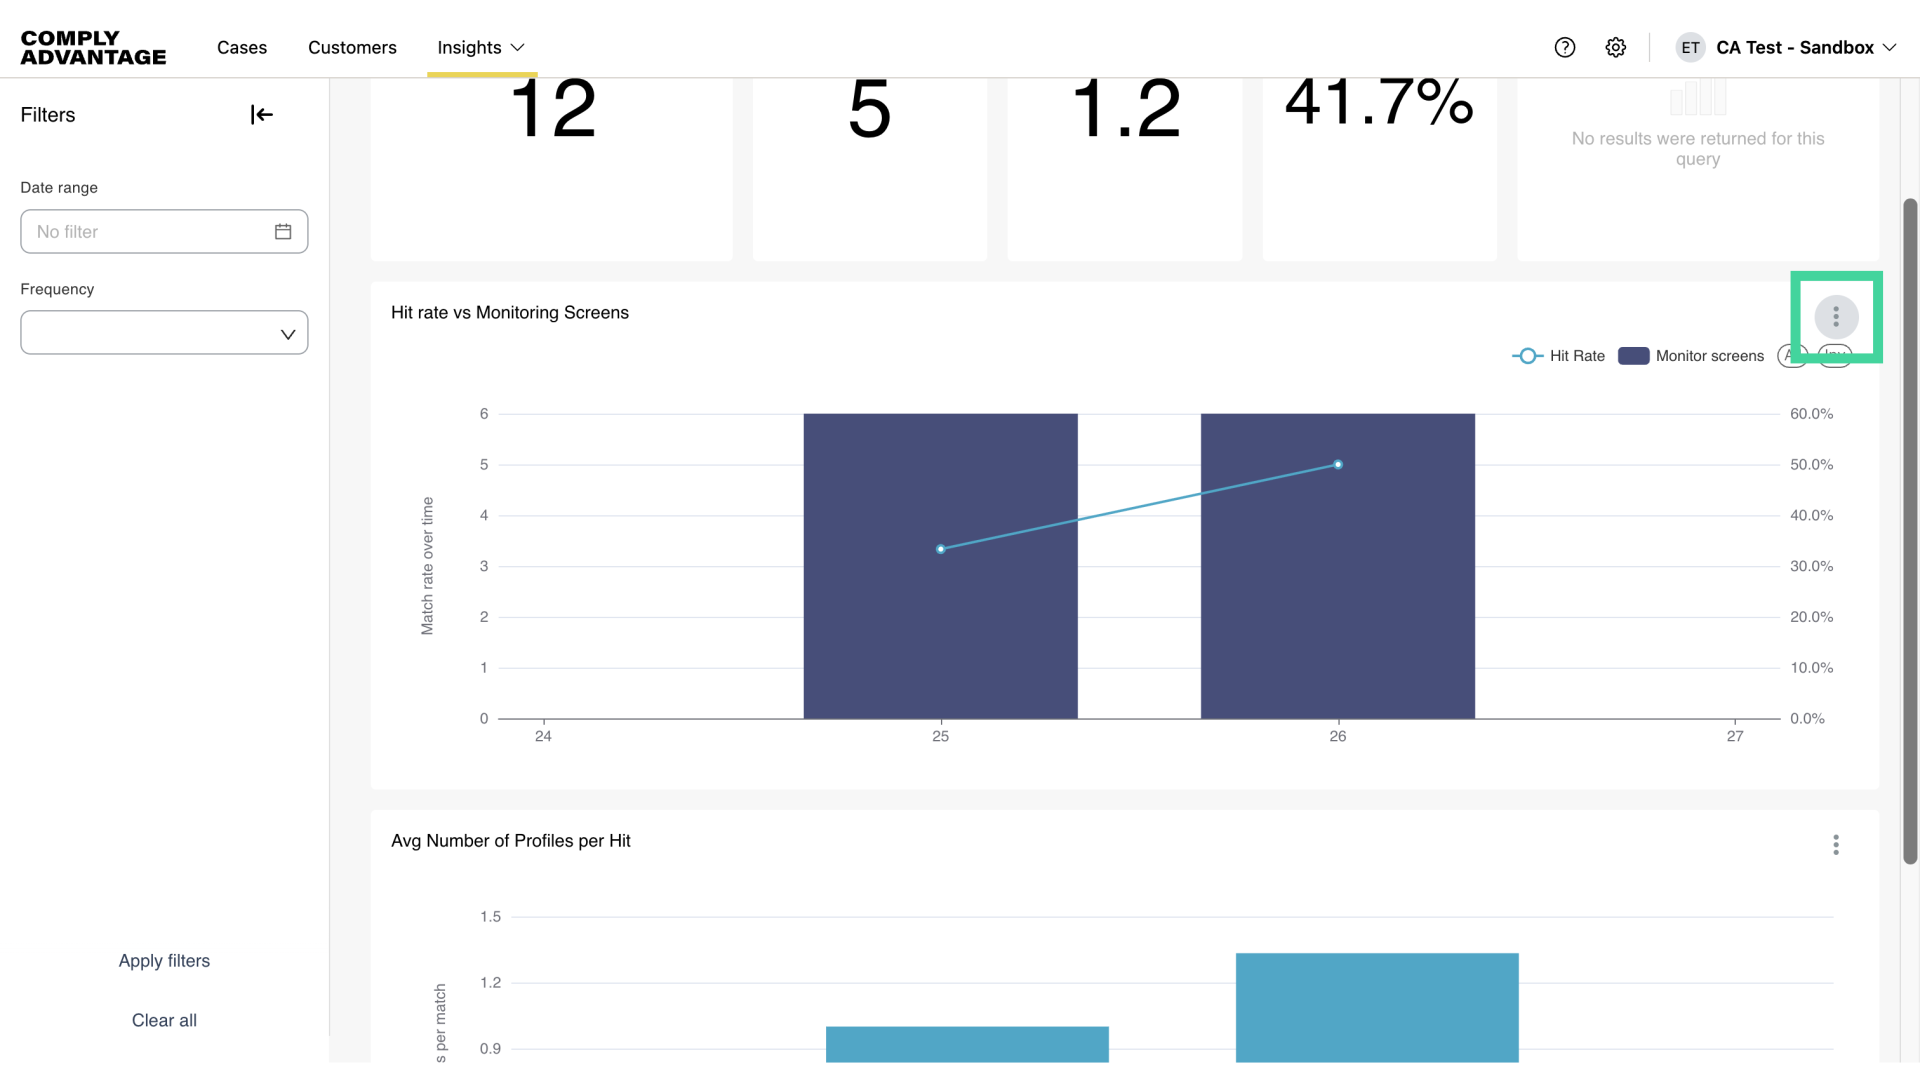
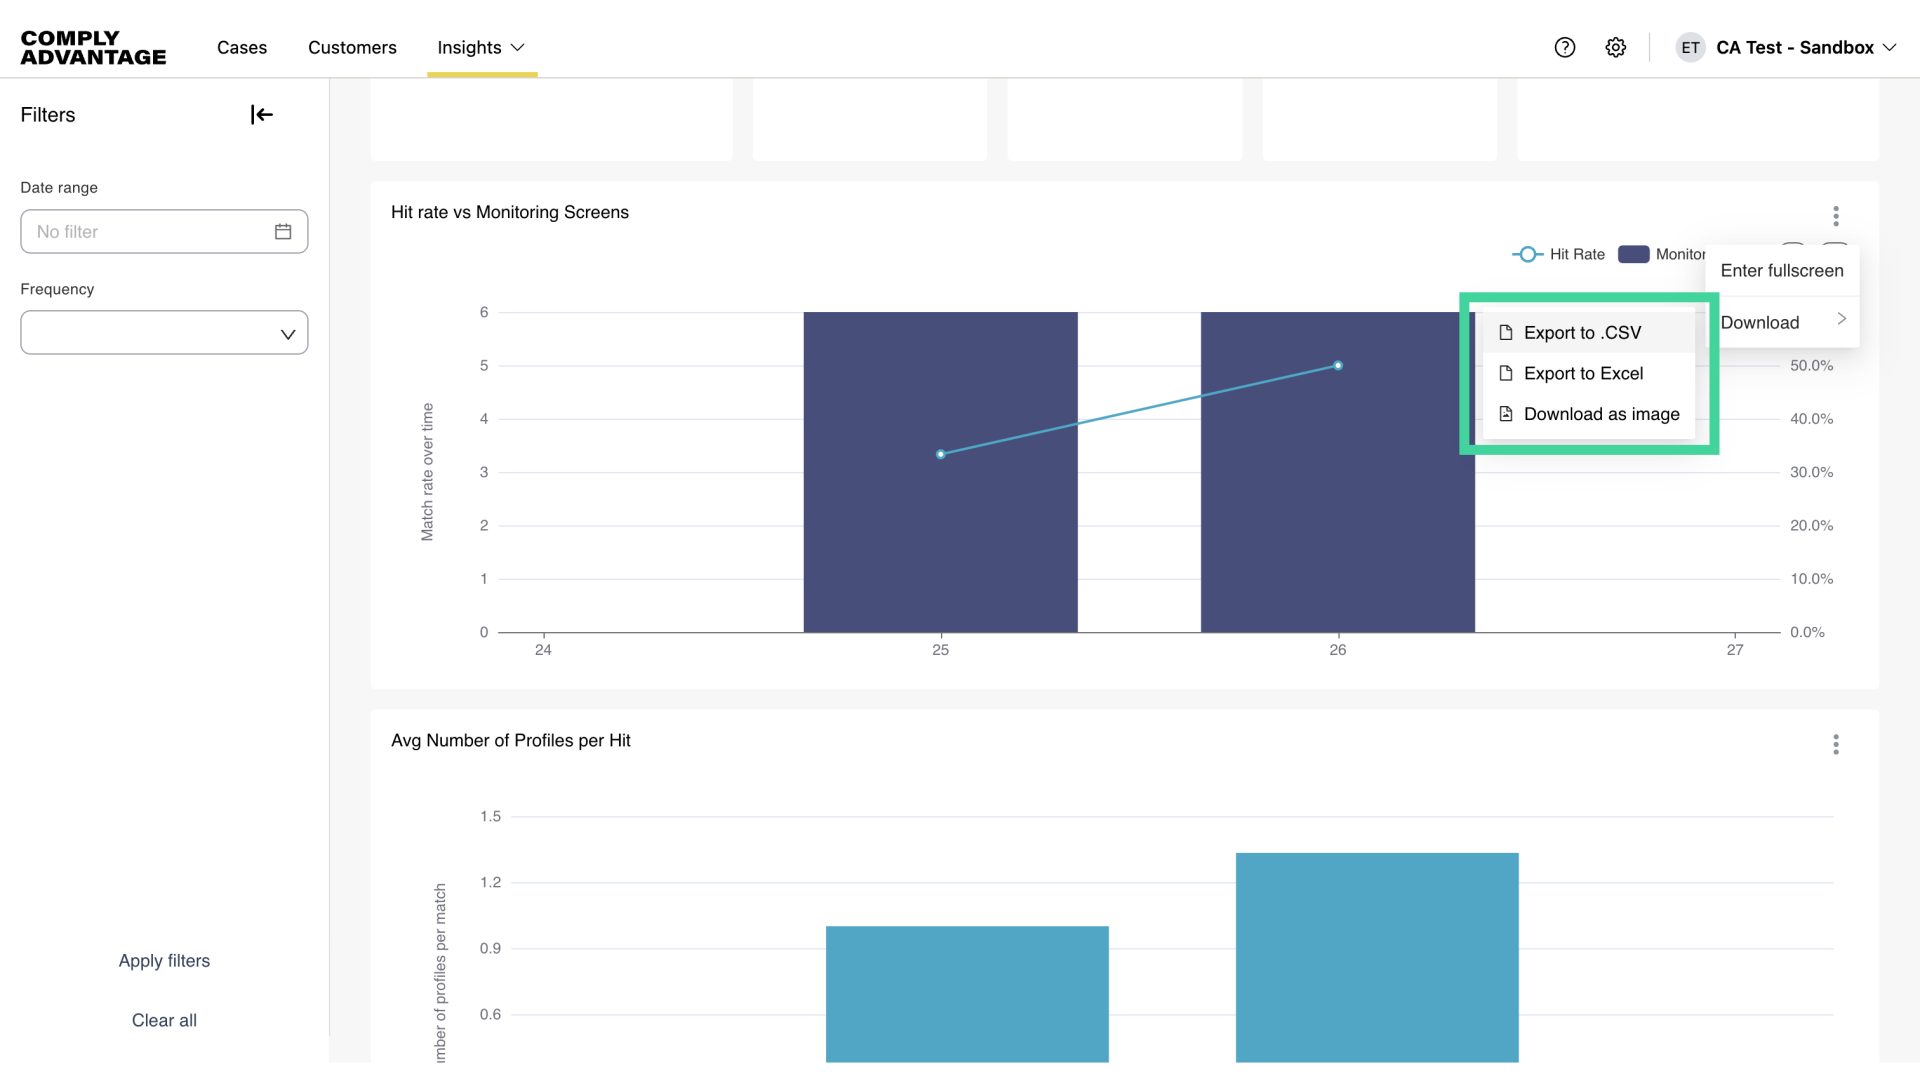
16. Download insights
You can download insights data and images for a chart to use outside of Mesh. First, click these three dots vertical dots.
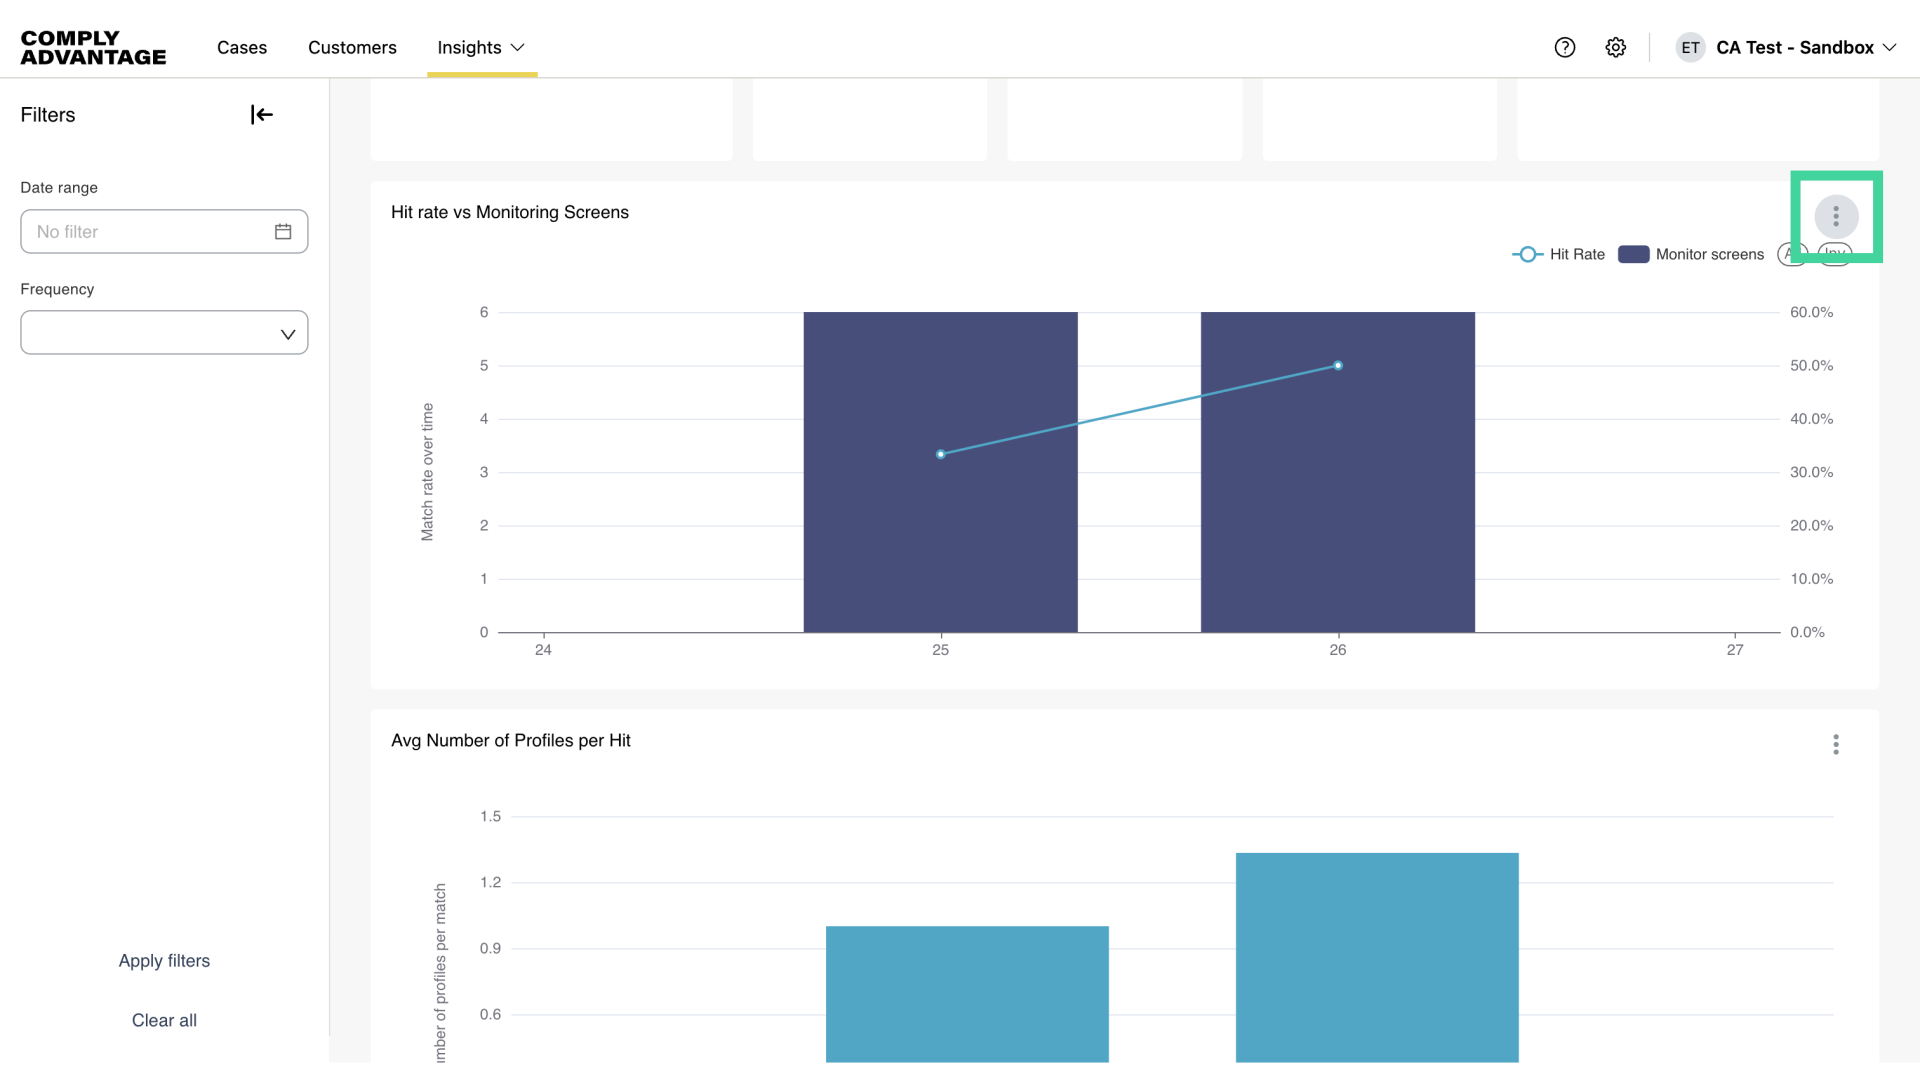
17. Select the relevant download option
Then, click download and export using the appropriate option.
We hope this guide helped you learn to apply filters, export data, and navigate monitoring screens effectively for enhanced reporting capabilities.