Video: Viewing insights into cases
Last updated: April 7, 2026
In this guide, you will learn how to view and analyze the Cases insights tab in Mesh.
When logging in to your account, please ensure you select the correct region, which will be one of the following:
Australia: https://au.mesh.complyadvantage.com/
You can find the link to your region in the onboarding email you received (look for the "Welcome to ComplyAdvantage" email).
If you can’t find the email, don't worry! You can always contact our support team at [email protected].
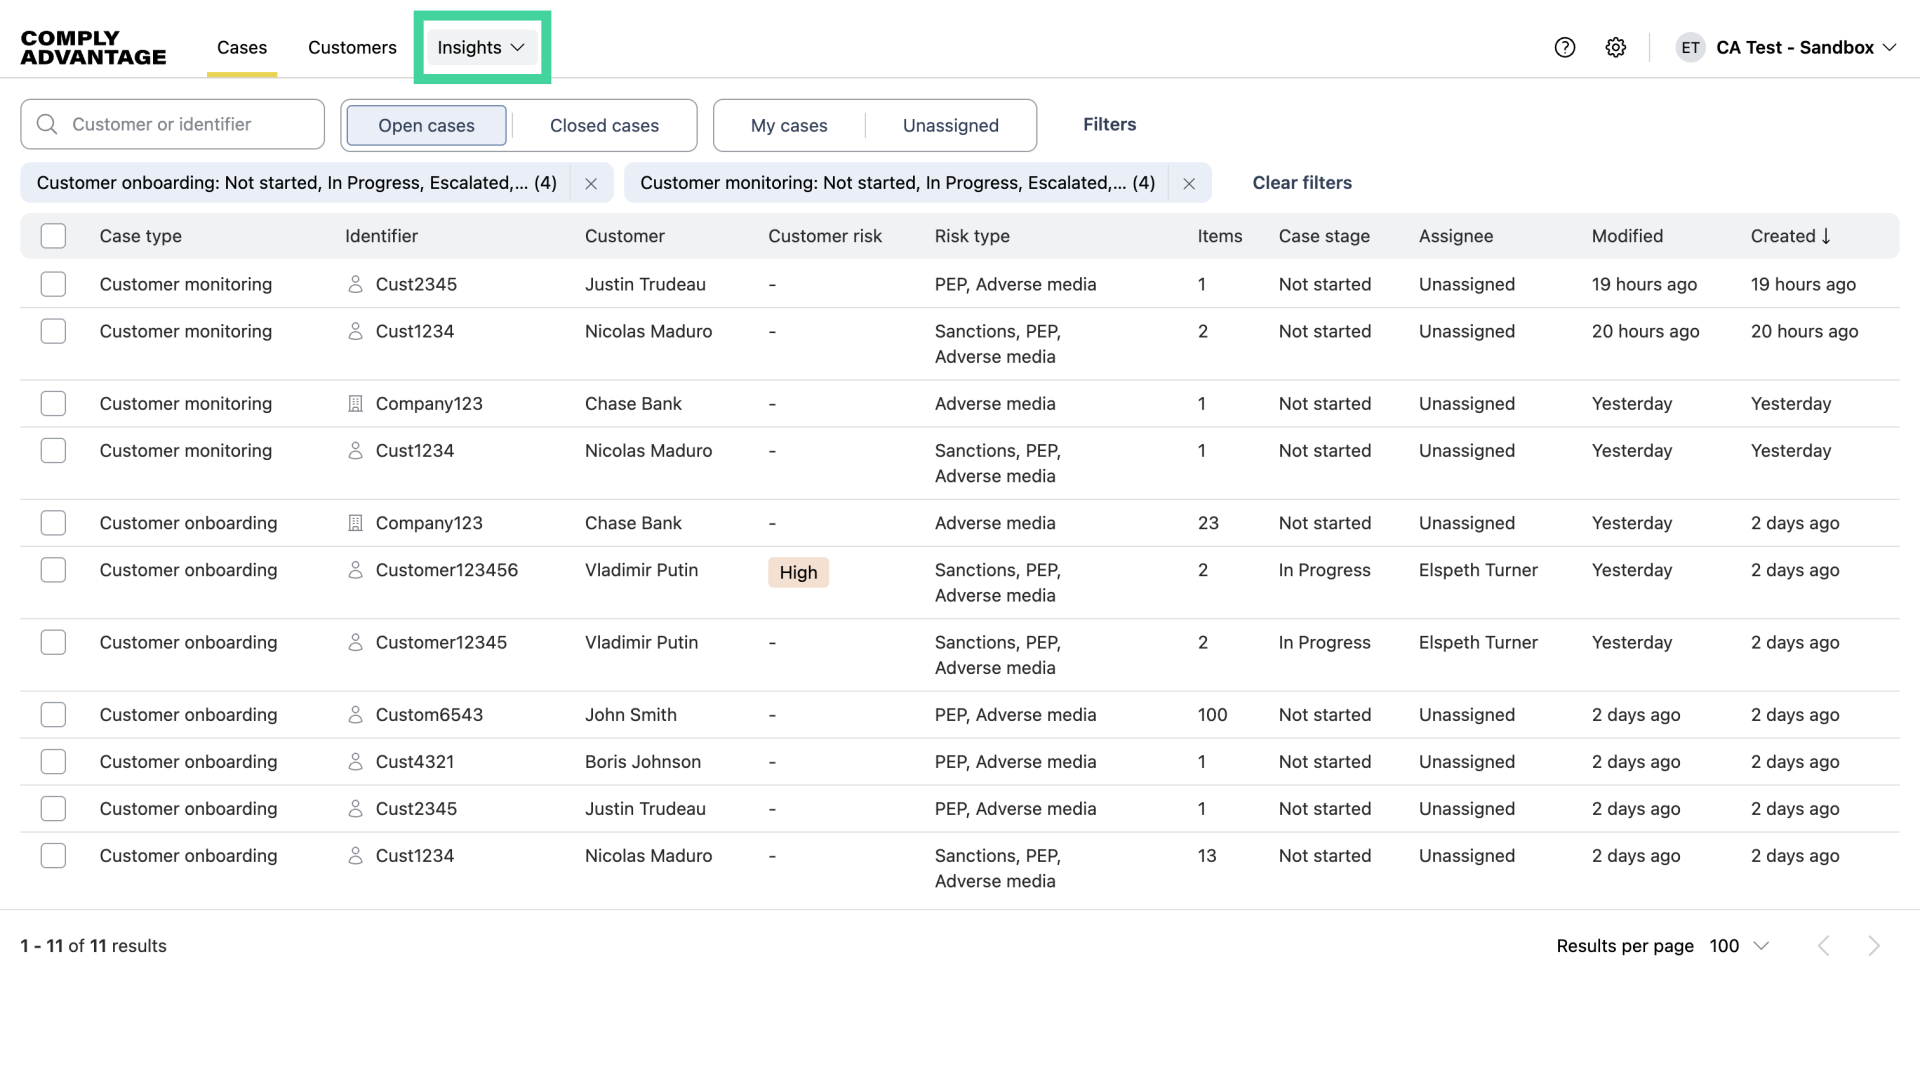
1. Click "Insights"
First, click "Insights."
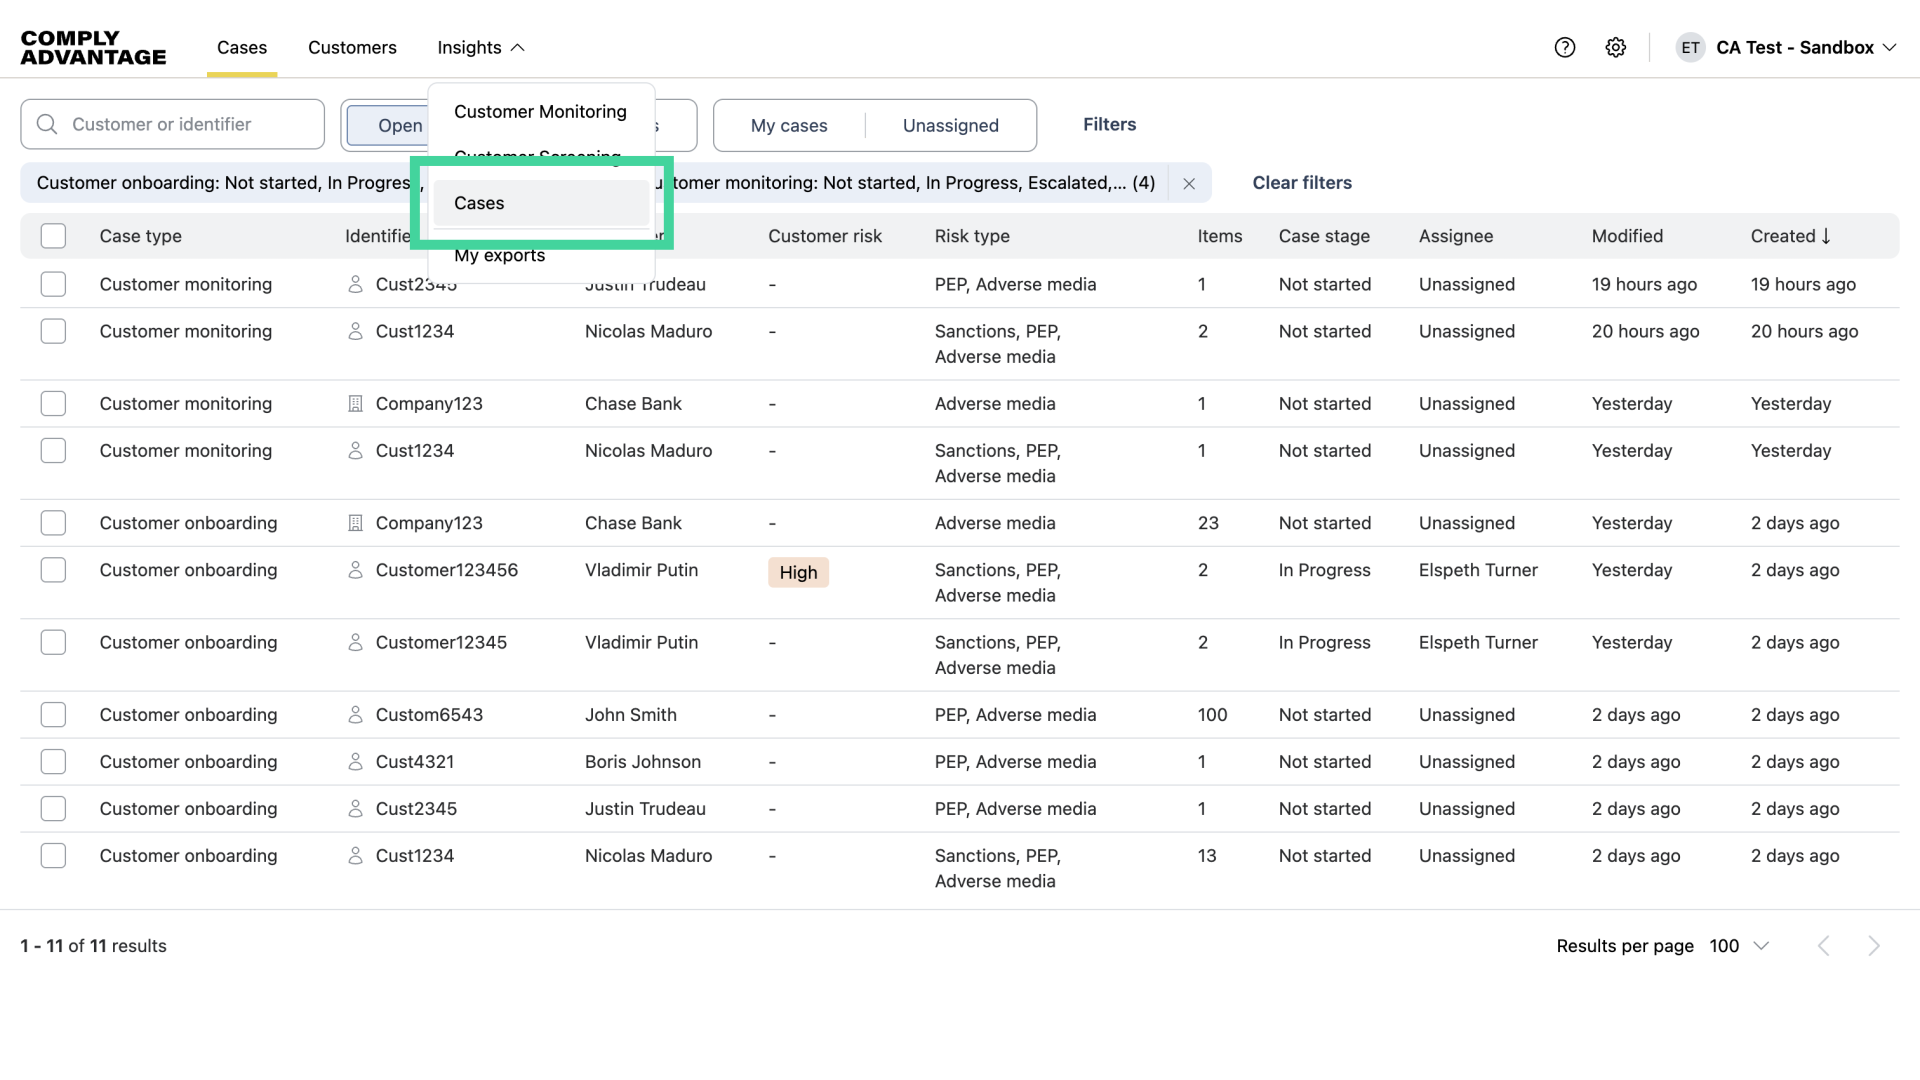
2. Click "Cases"
Then, "Cases."
3. Cases Dashboard
The cases dashboard helps you understand the performance of teams managing cases and alerts.

4. Cases Created and Not Started
Starting at the top, here you can see the number of cases created and those that haven't been started.

5. In Review
Here are the number of cases in progress.
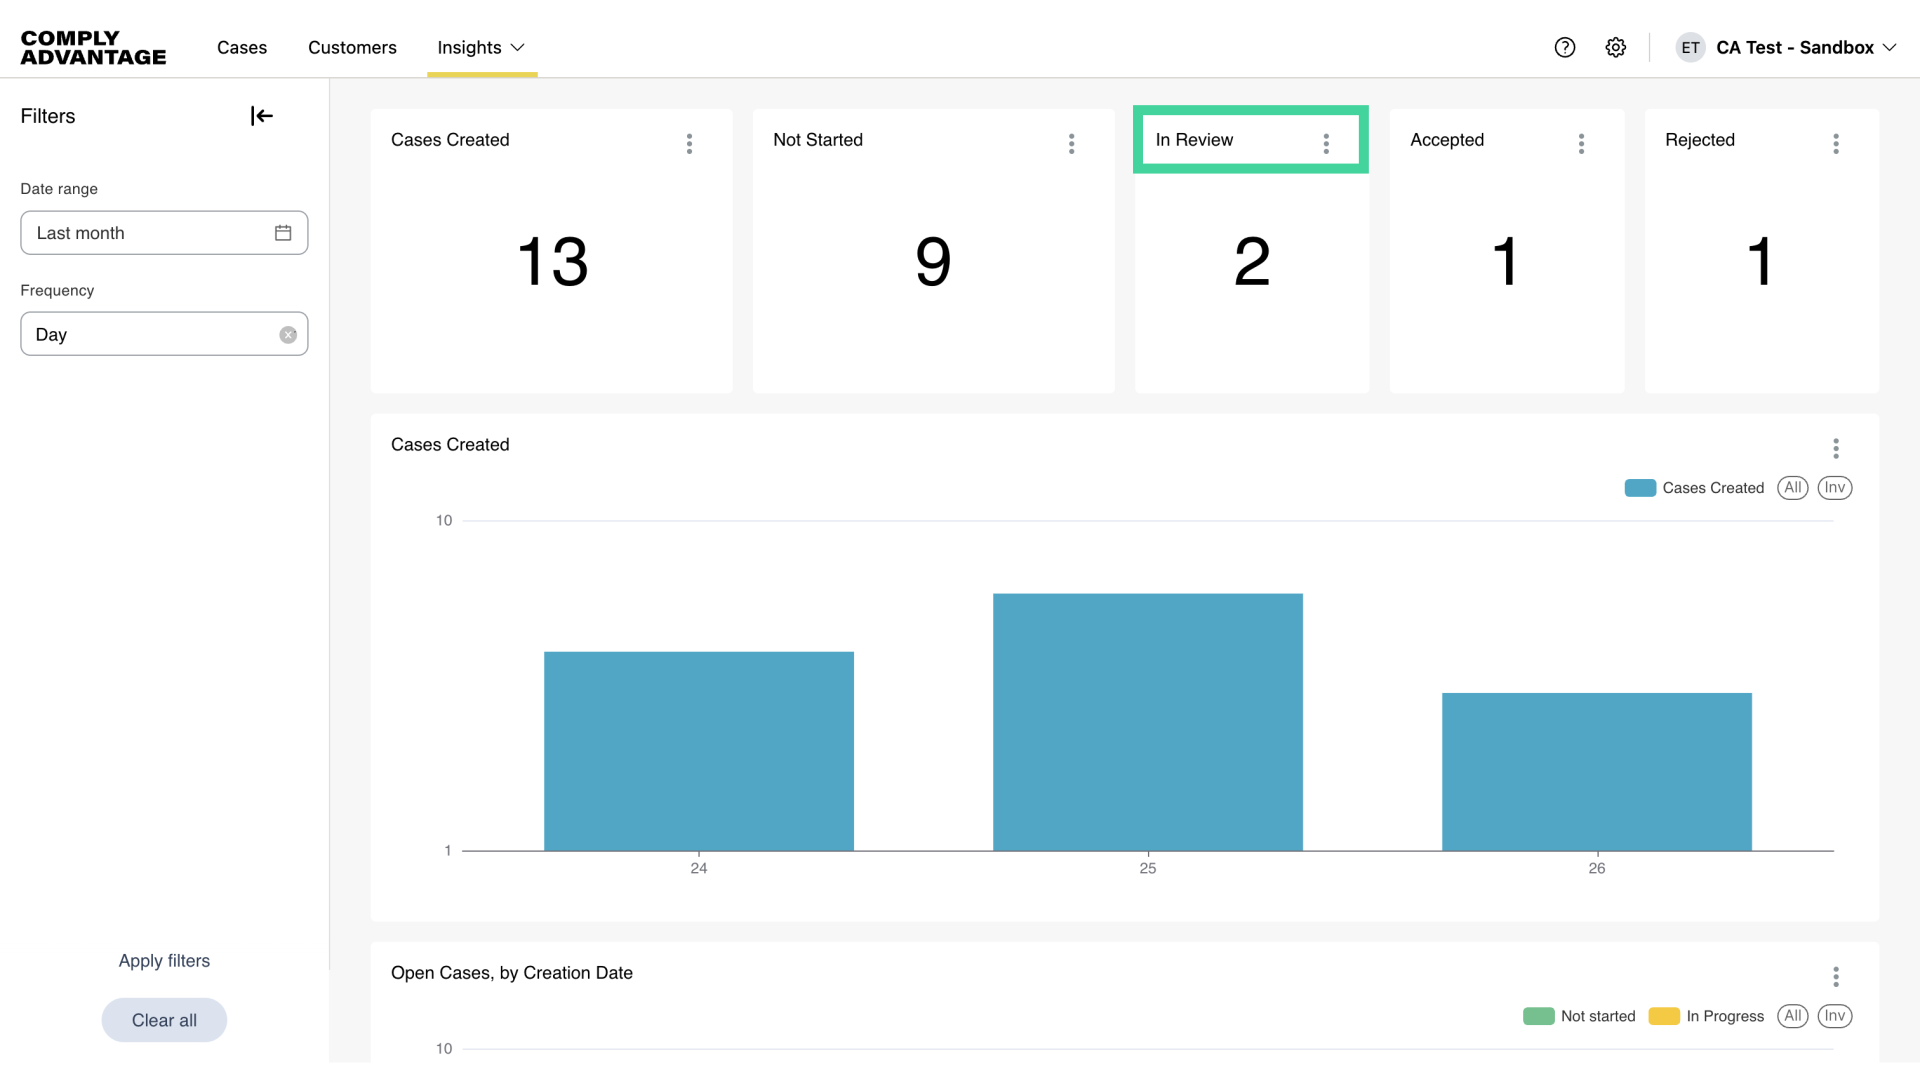
6. Accepted and rejected
And lastly, here are the number of cases with the decision "accepted" and "rejected."

7. Cases Created
Moving on to the chart section, the Cases Created chart shows the number of cases that have been created in a given period.
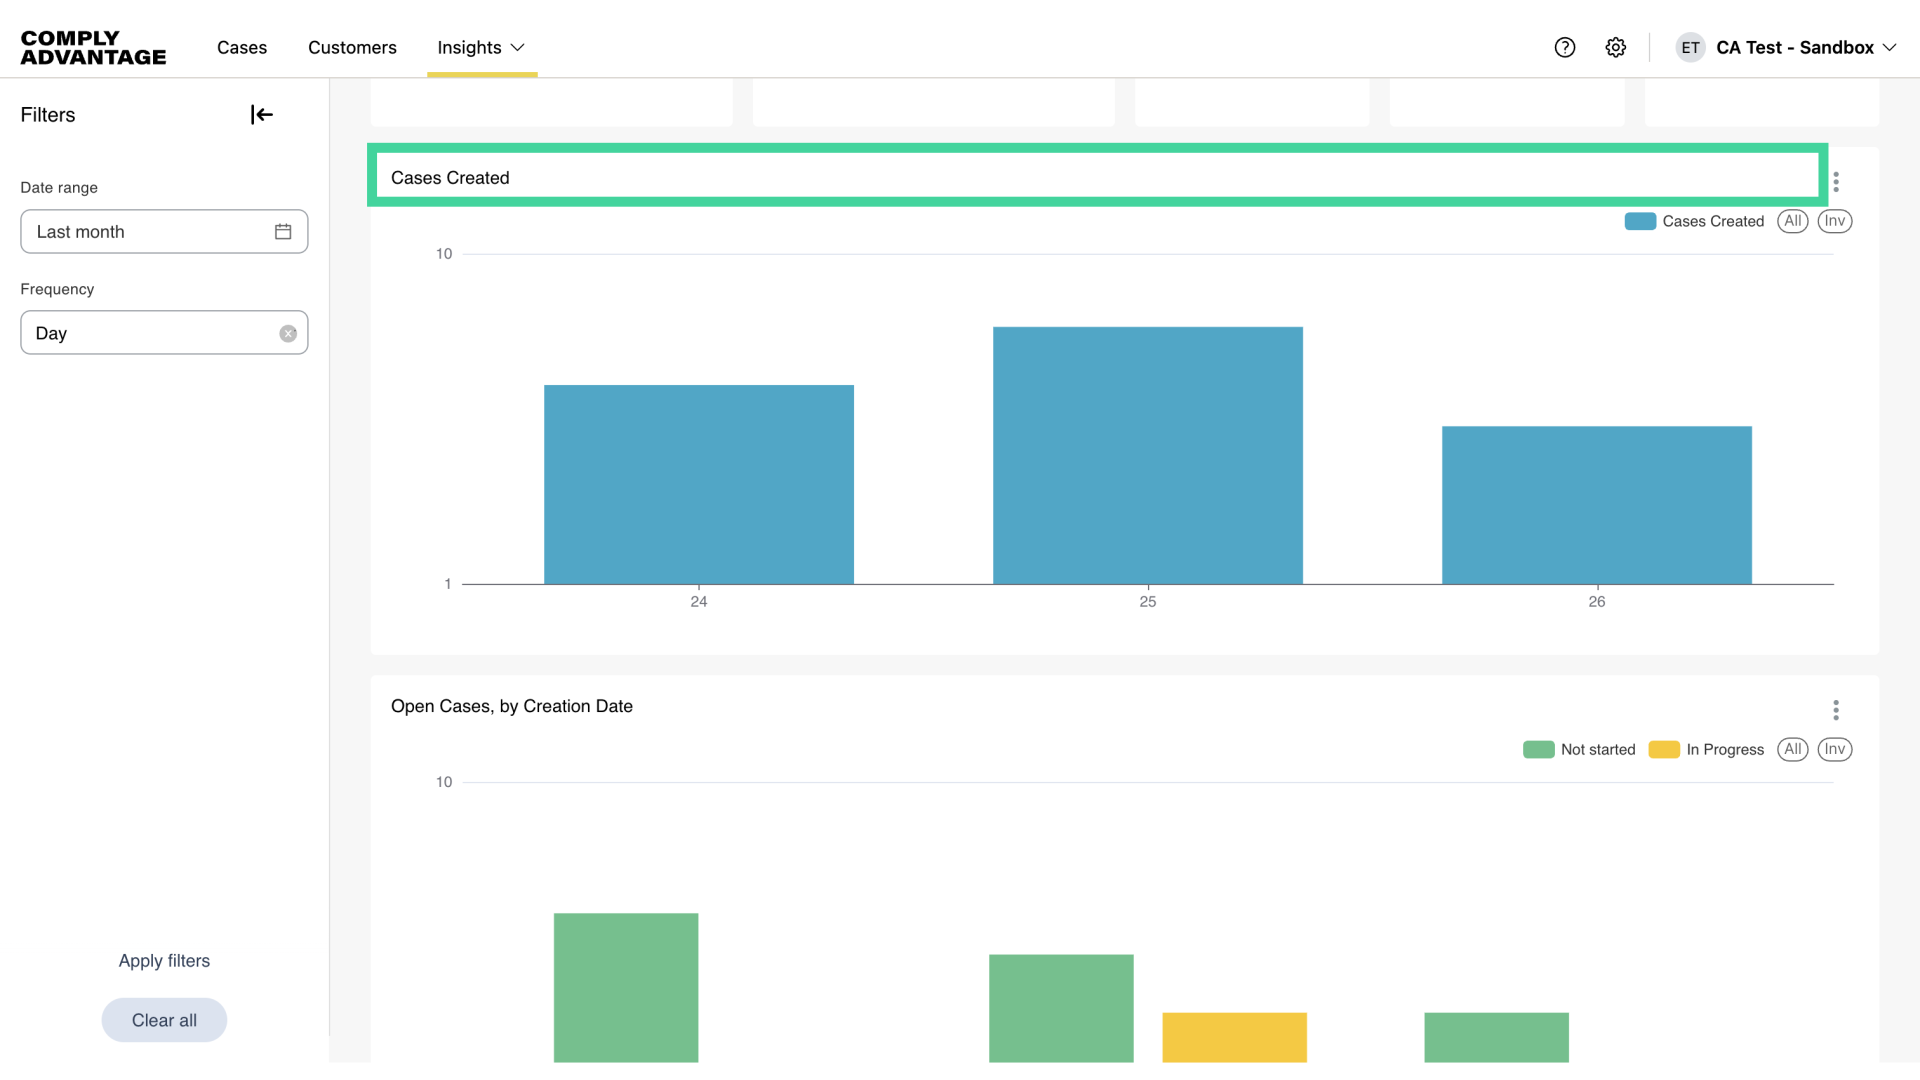
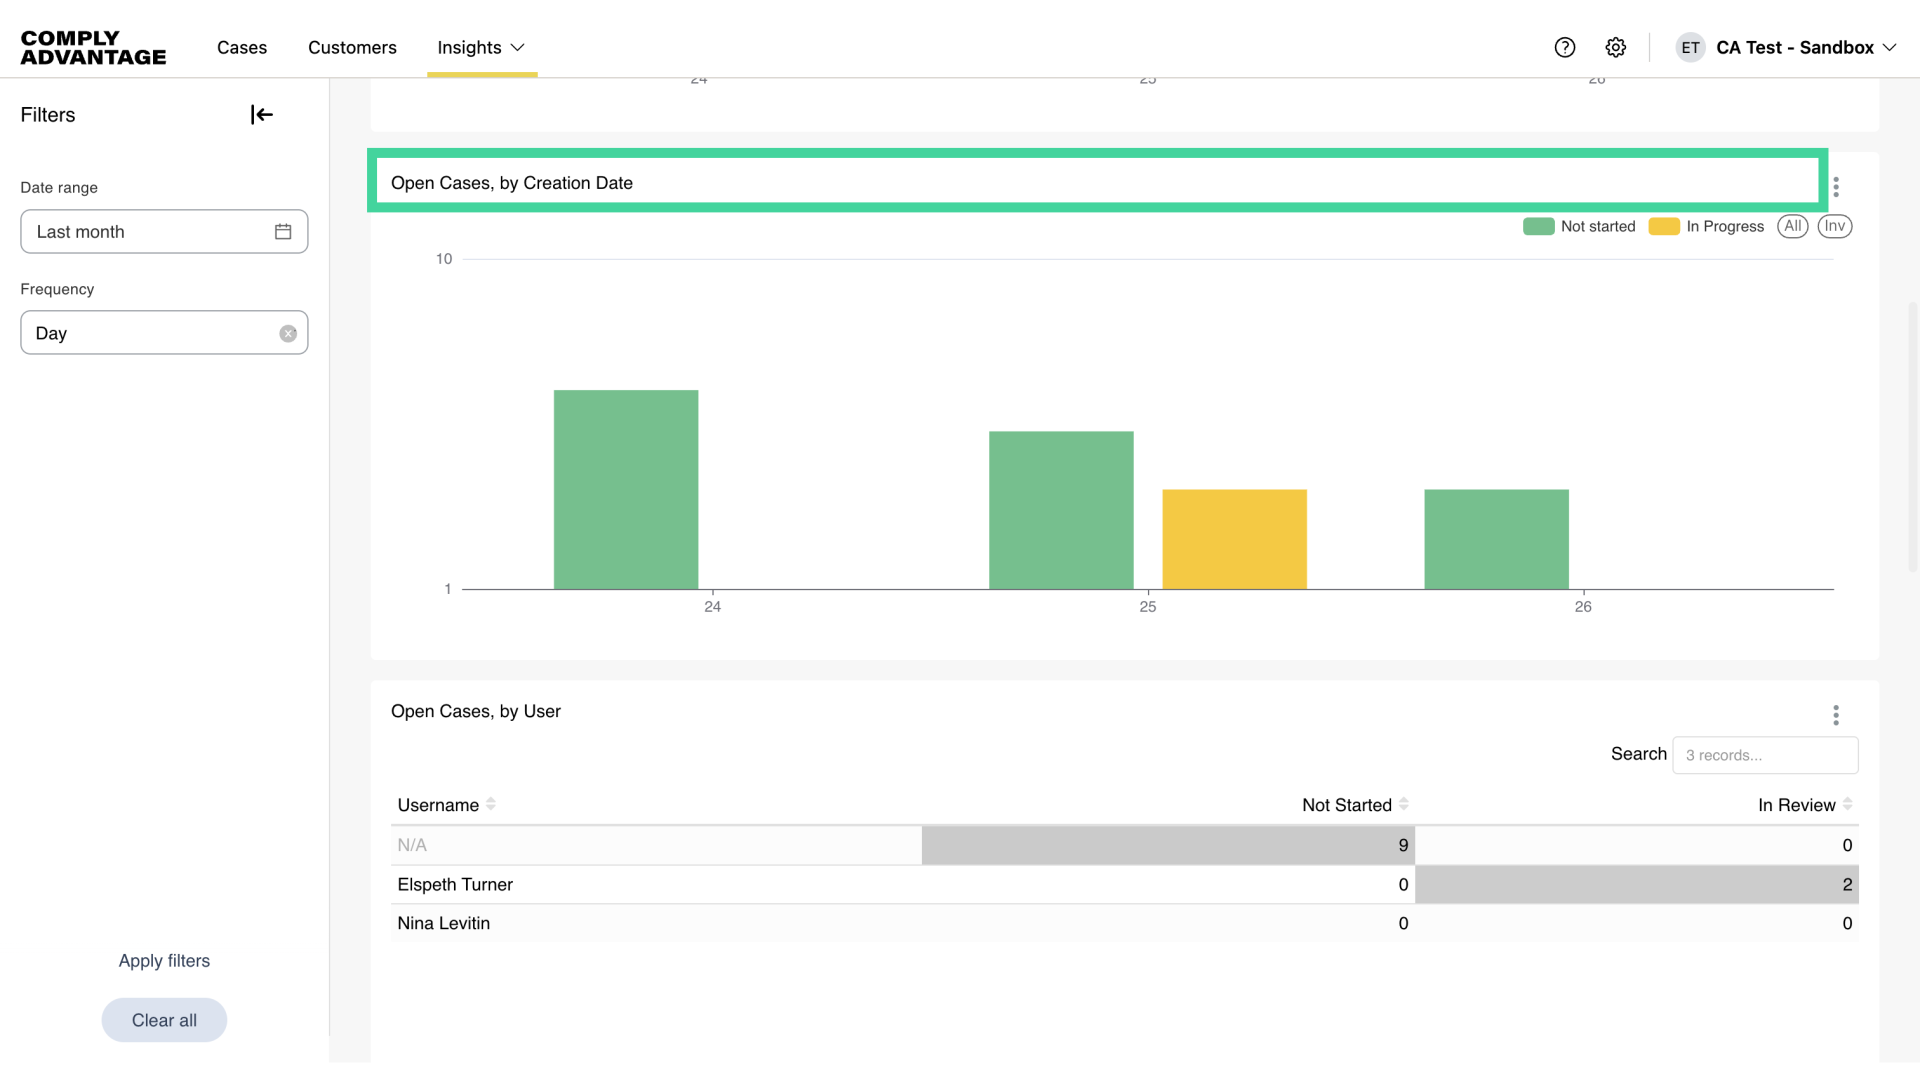
8. Open Cases, by Creation Date
The chart of Open Cases by Creation Date shows your backlog of cases. They are sorted by when they were created and split into those that are Not started and In progress. This shows how many cases are outside of your service level agreement, and what proportion of them are already being worked on.
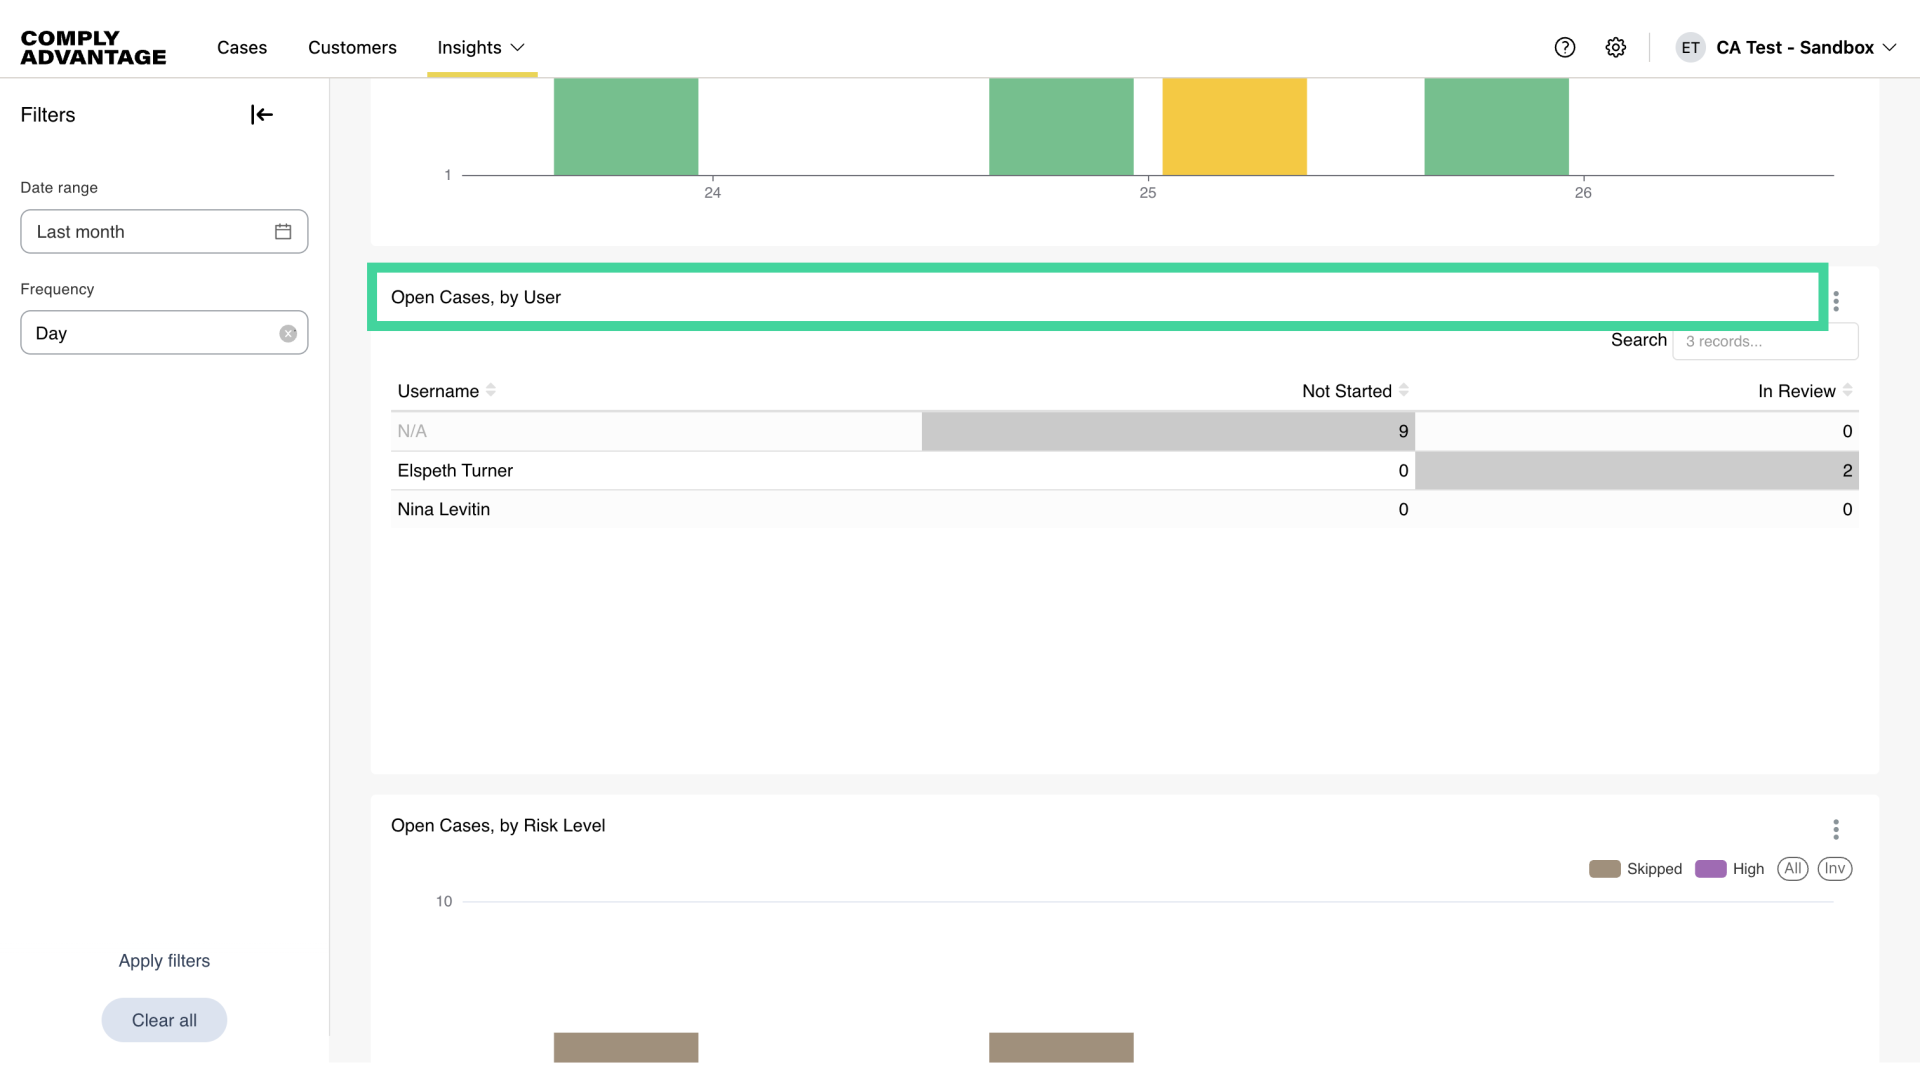
9. Open Cases, by User
The Open Cases by User chart shows the breakdown of cases in your backlog per analyst. This is useful for seeing the distribution of workload across your team and how well cases are progressing.
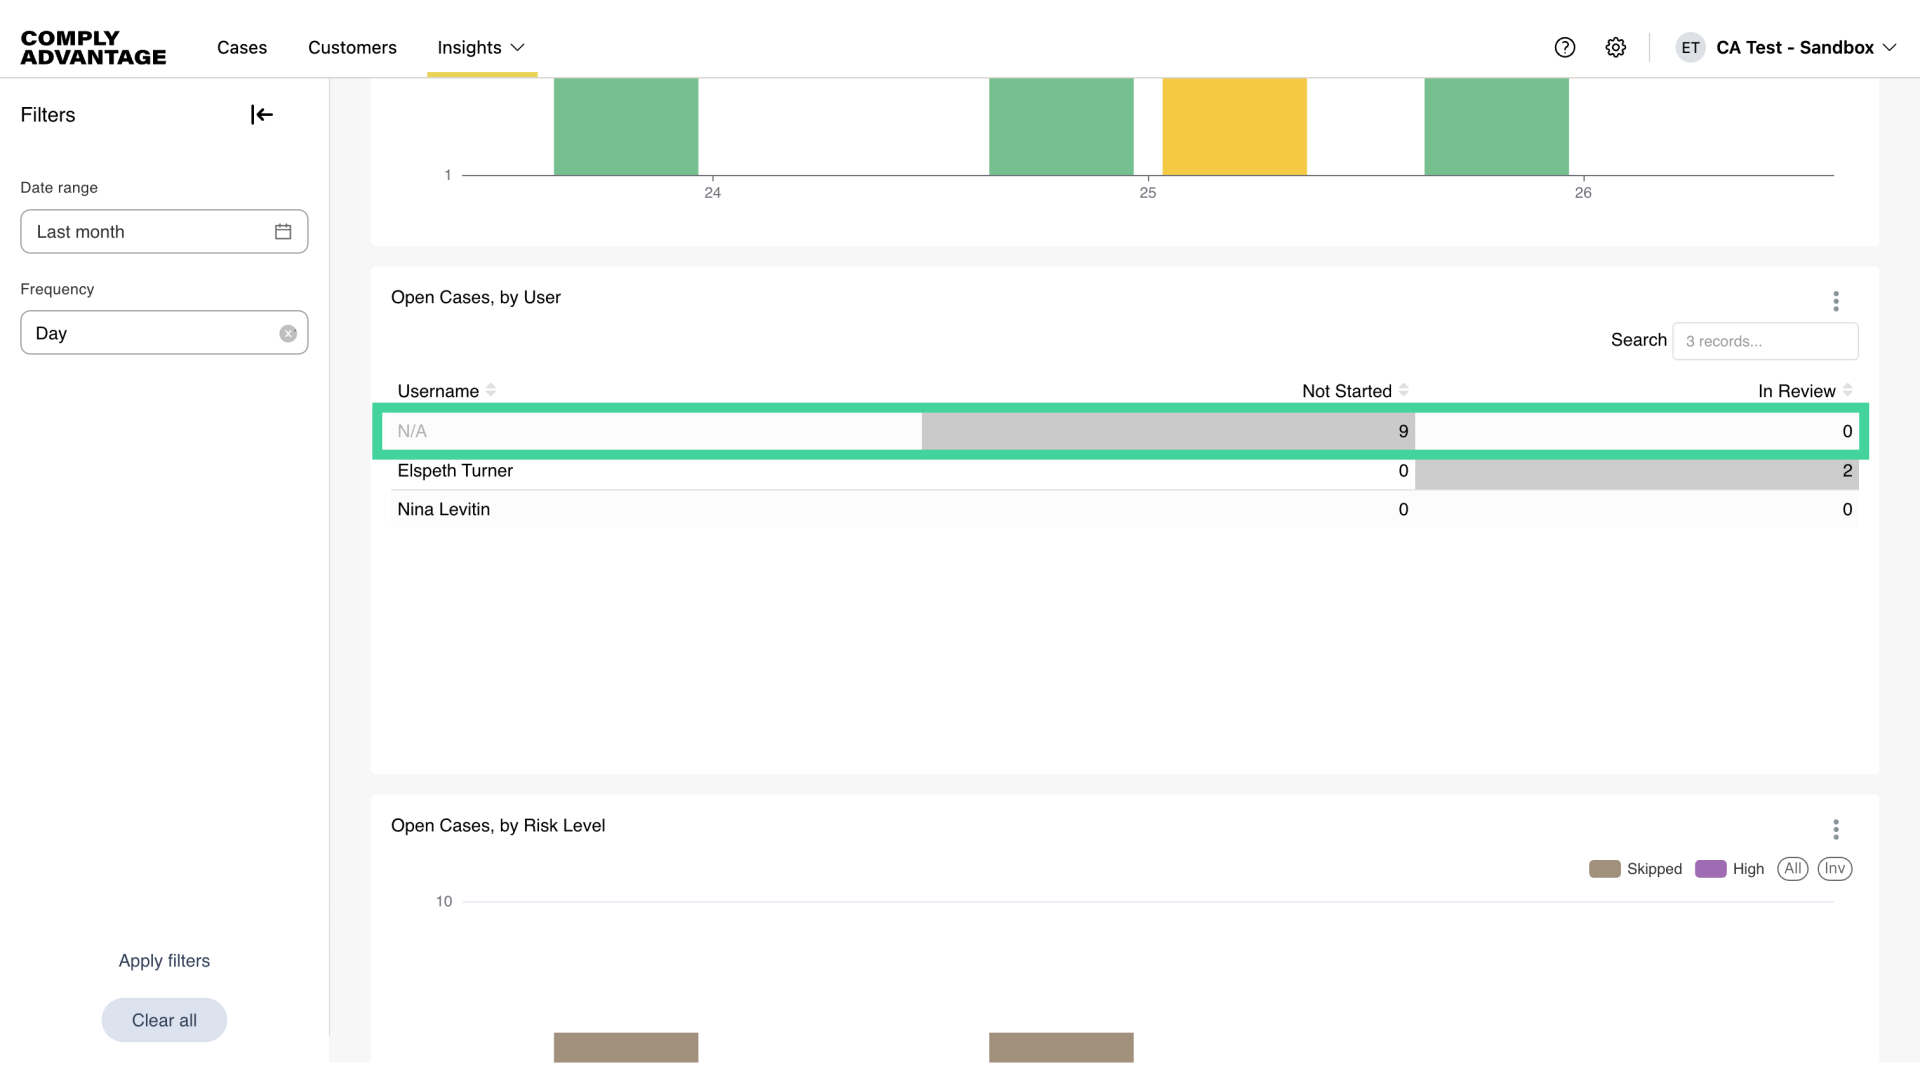
10. Unassigned cases
The top row shows how many cases are unassigned.
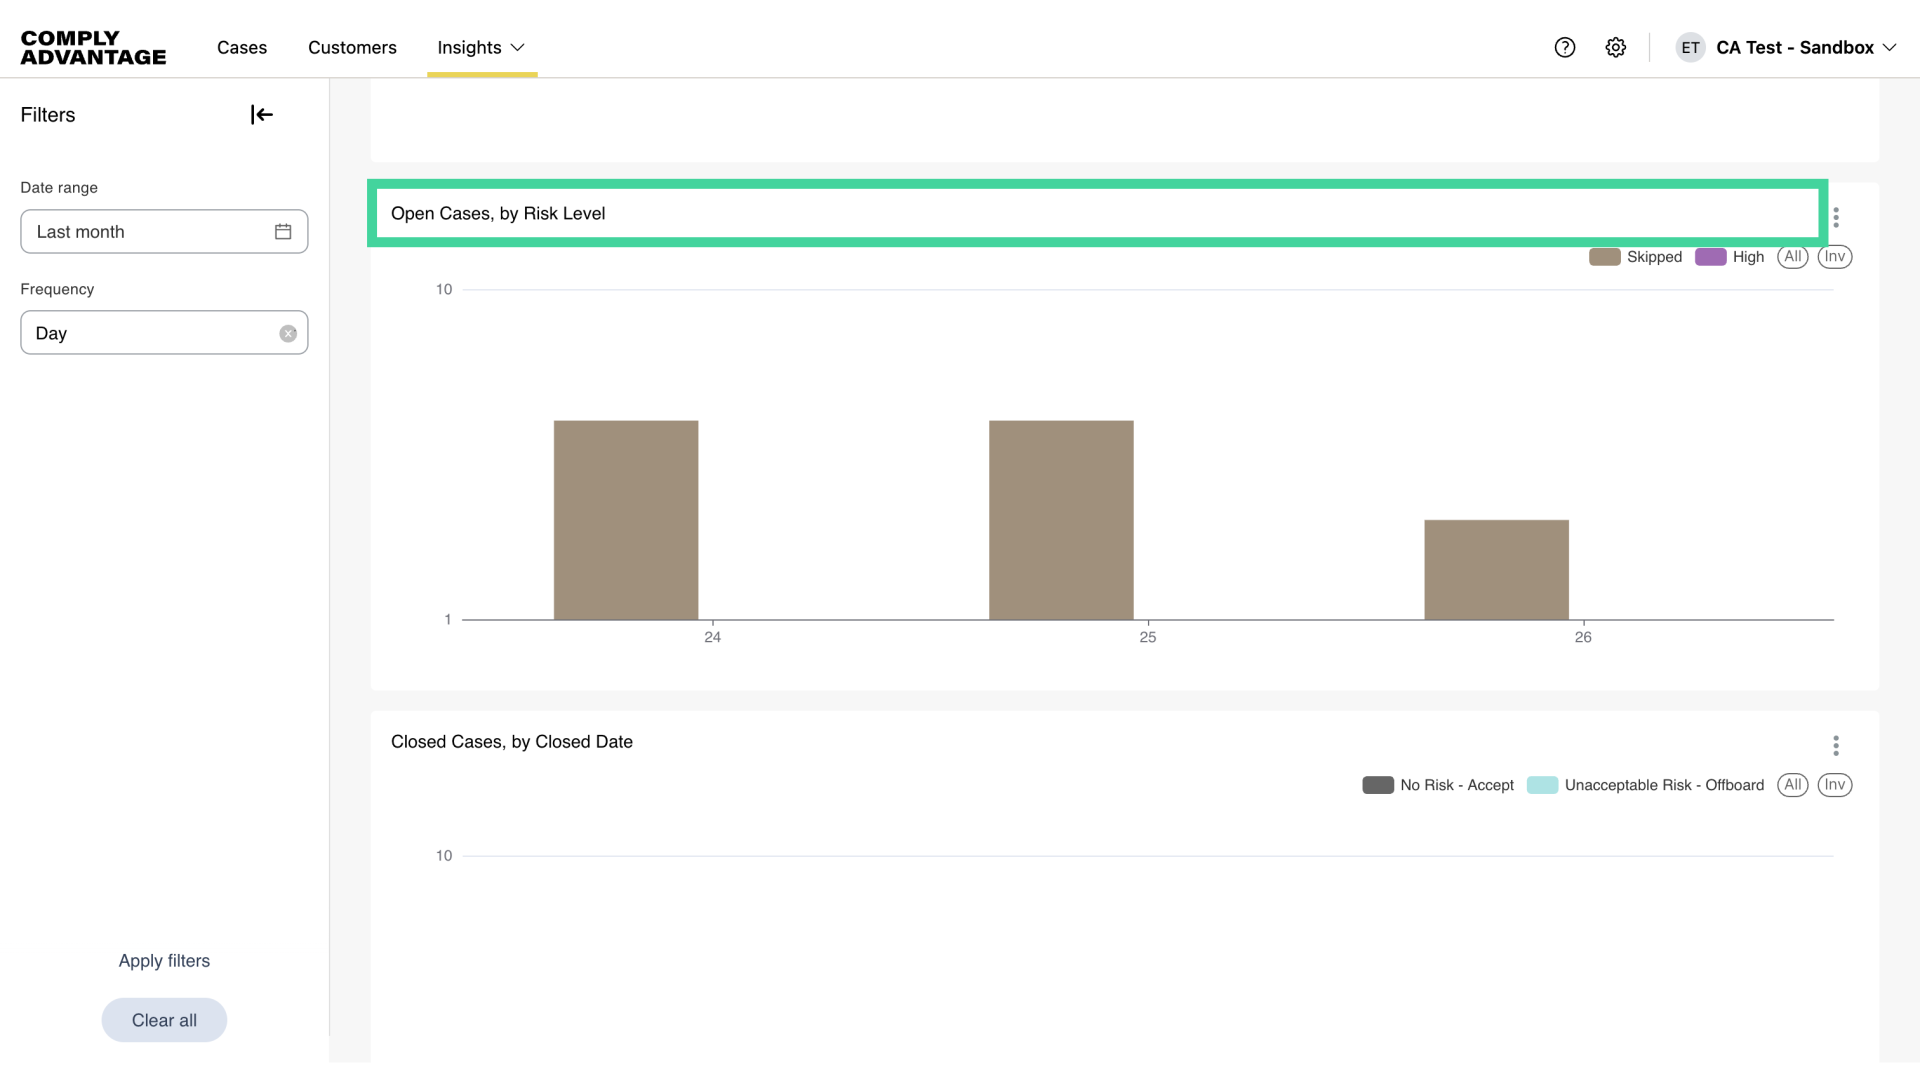
11. Open Cases, by Risk Level
If you are using risk scoring in Mesh, you can see your backlog of open cases by risk level, sorted by creation date. This shows how many of your open cases involve high-risk customers so that you can better prioritize work.
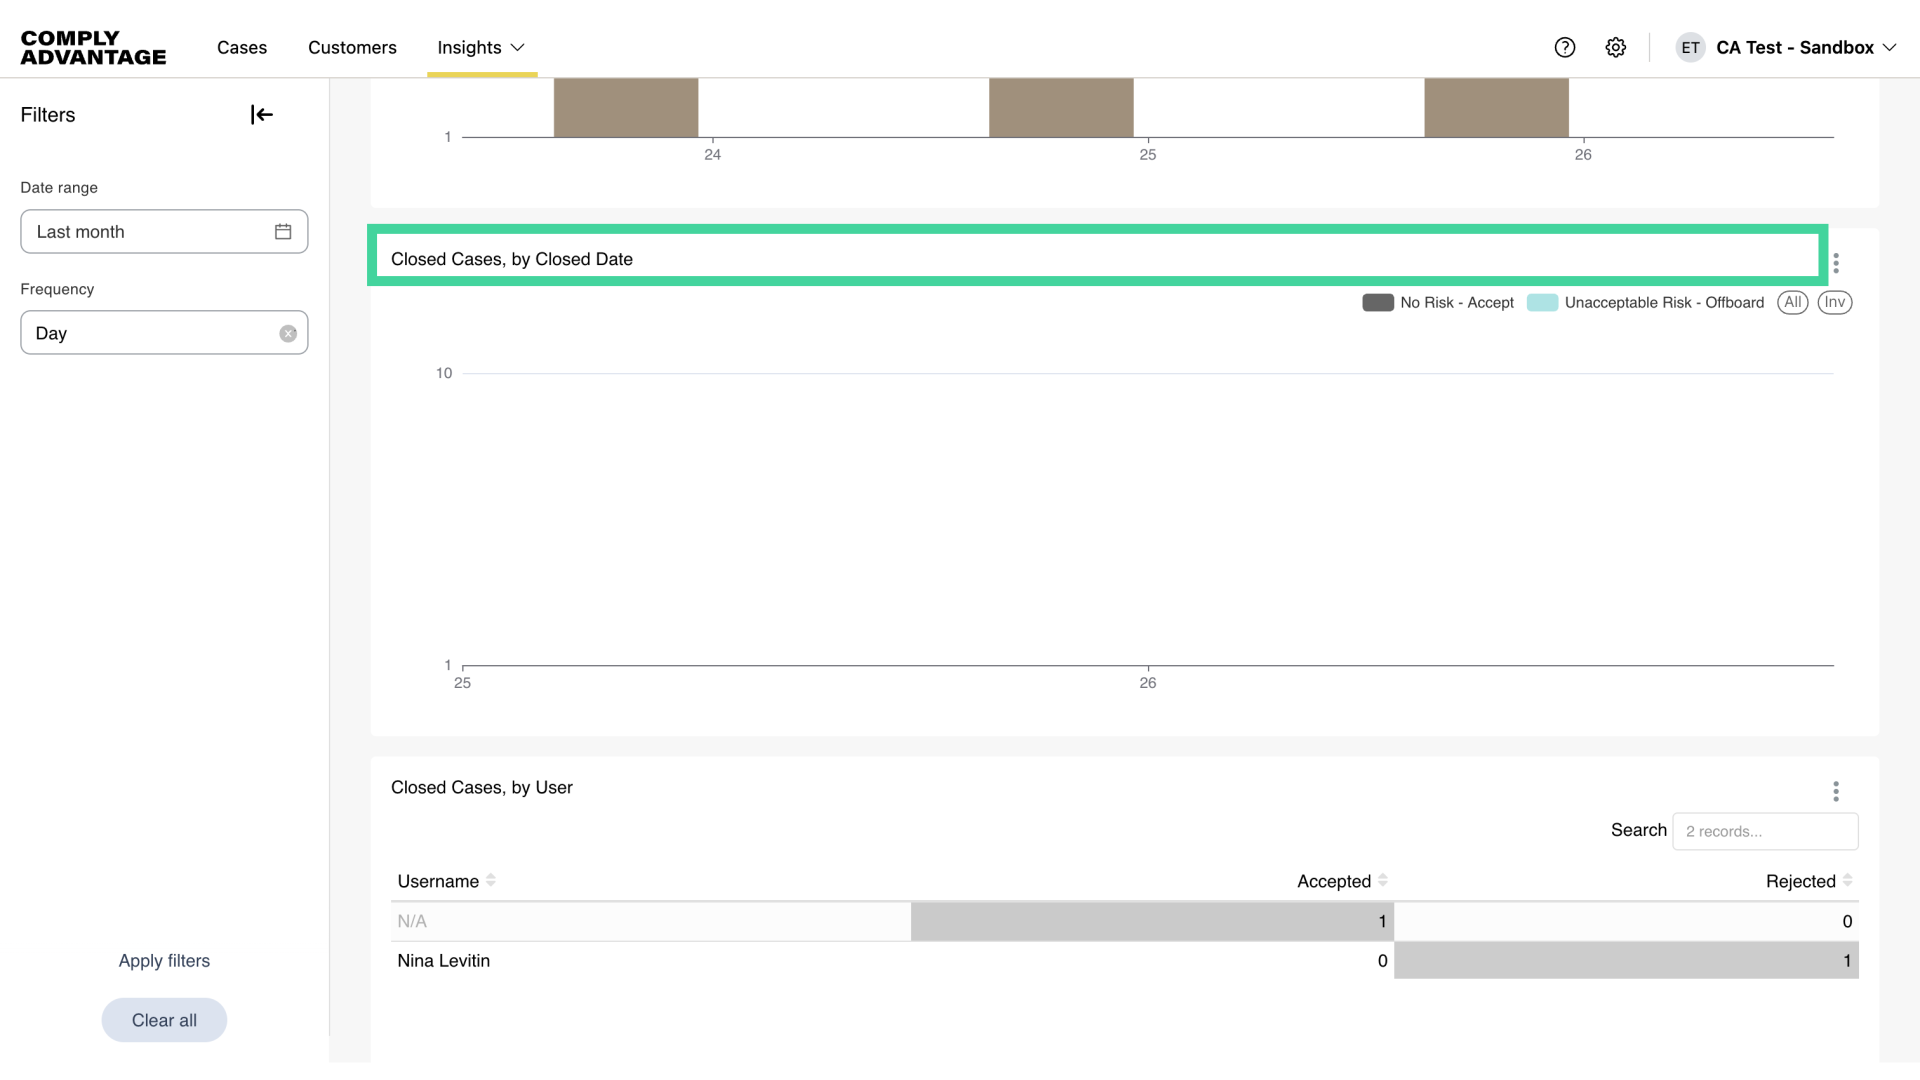
12. Closed Cases, by Closed Date
The chart of Closed Cases by Closed Date shows your throughput, with the cases split by decision. The chart helps you understand how many cases your team is closing over a period of time and the distribution of cases that are accepted and rejected.
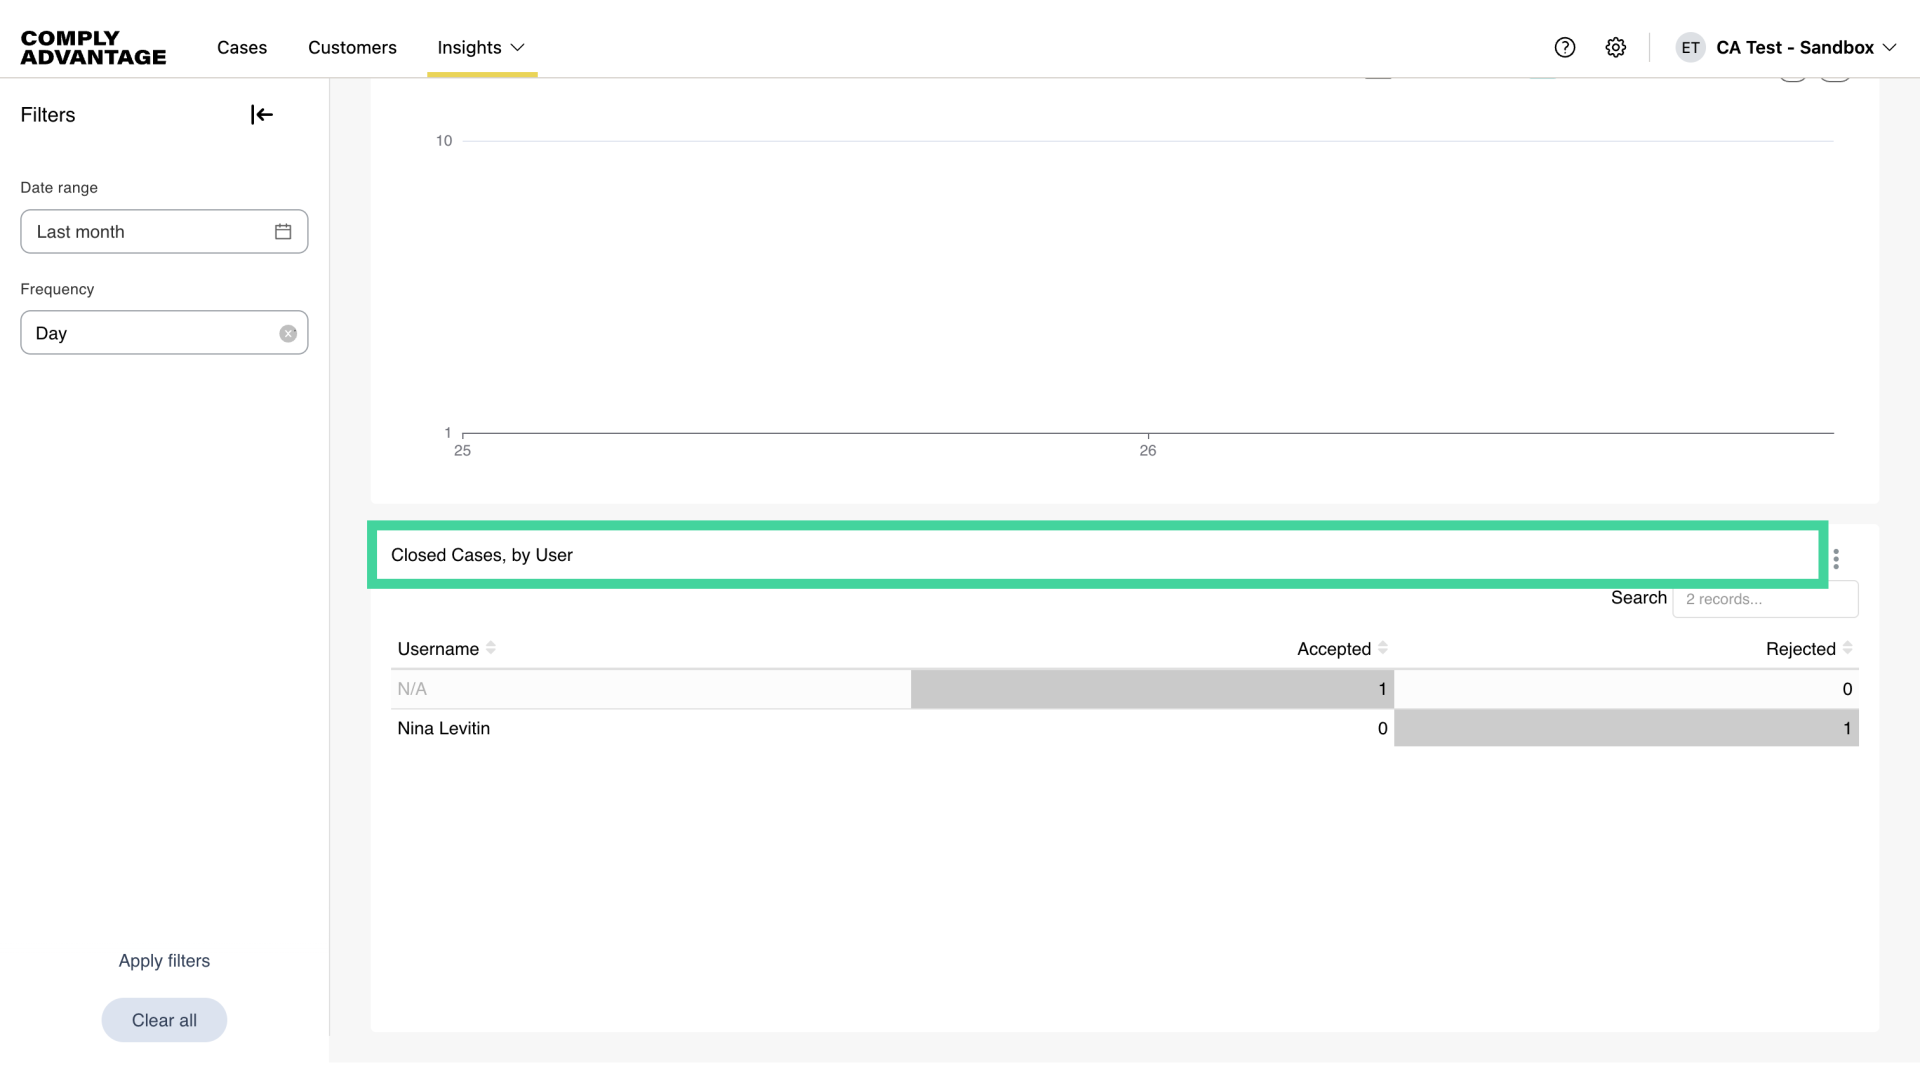
13. Closed Cases, by User
The chart of Closed Cases by User shows many cases your analysts are closing and the distribution of their decisions.
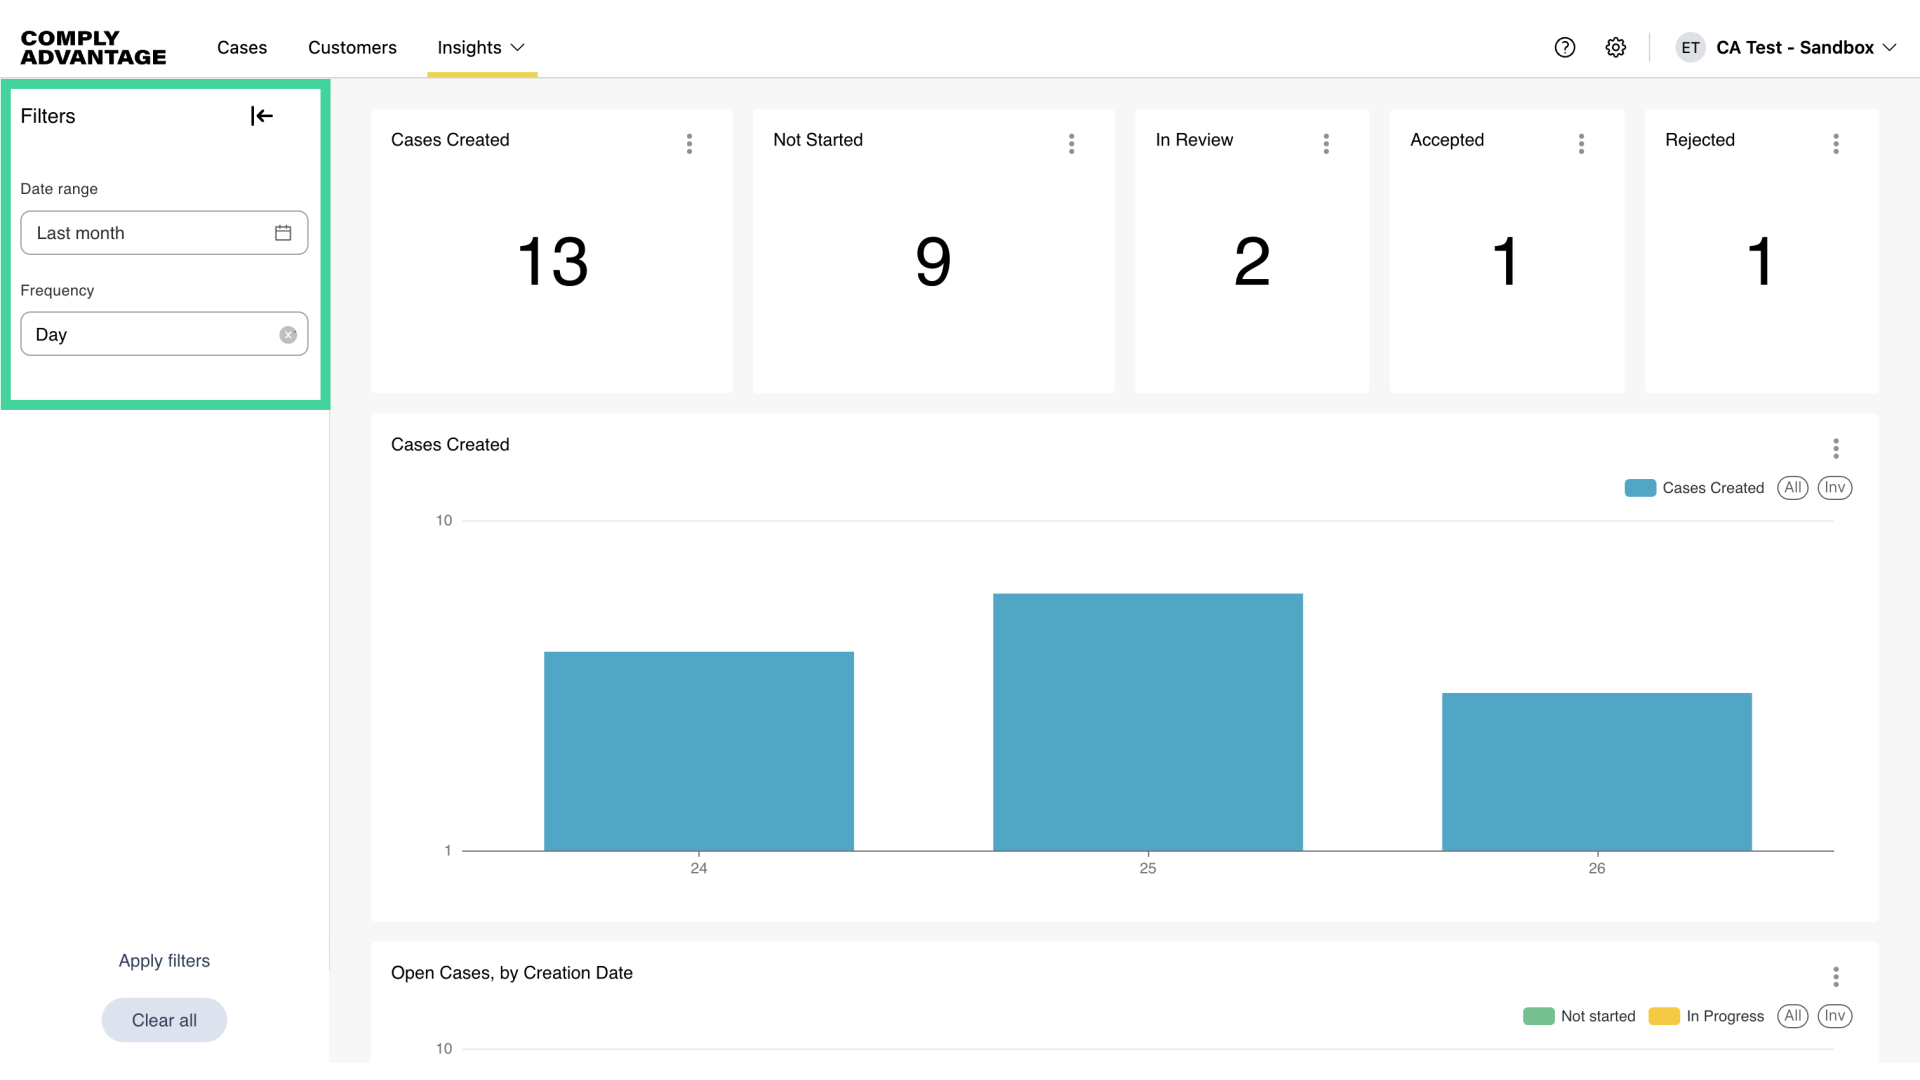
14. Filters
The default date range is the last 30 days, and the default frequency is daily. You can change the date range and frequency to filter to your preferred time frame.
15. Click here
You also have the option to view the charts in a larger format for better visibility.
16. Click "Enter fullscreen"
Click here to "Enter fullscreen" mode.

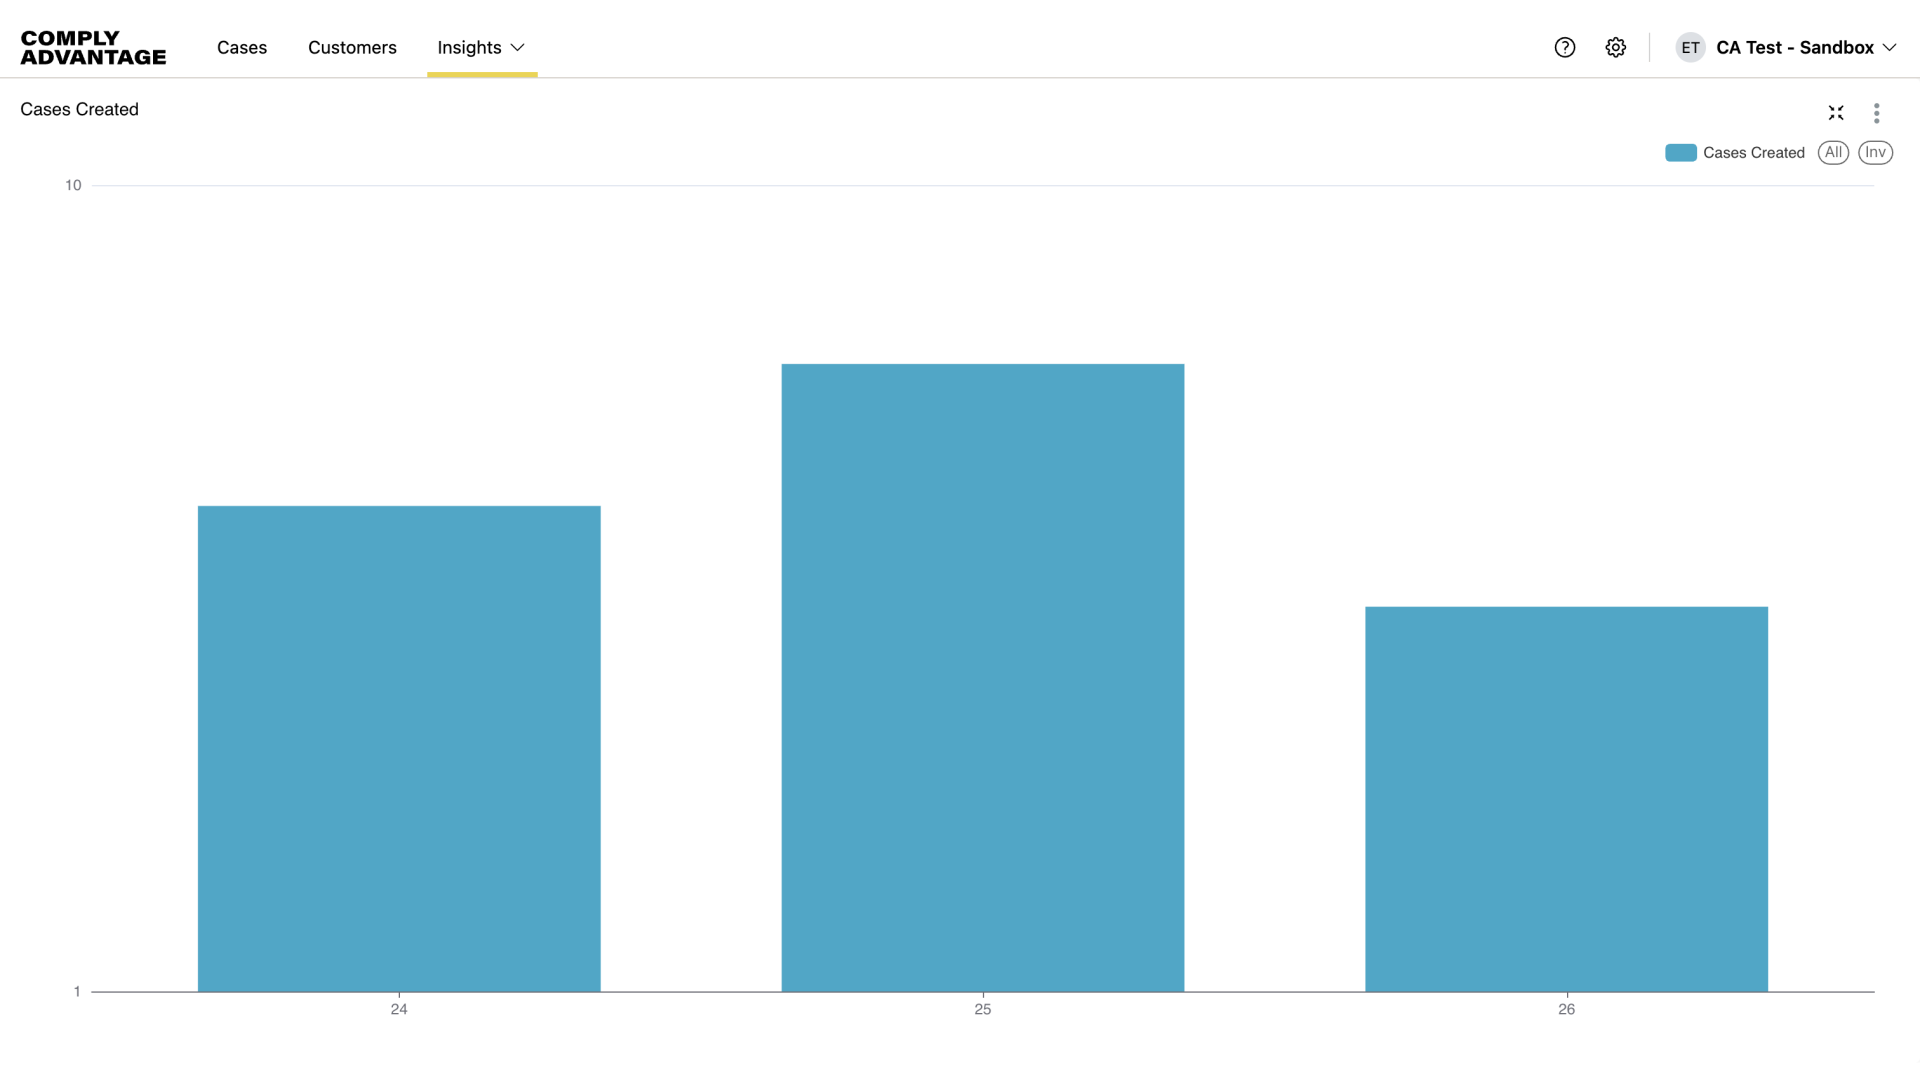
17. Full screen
You can now view the charts in an expanded format.
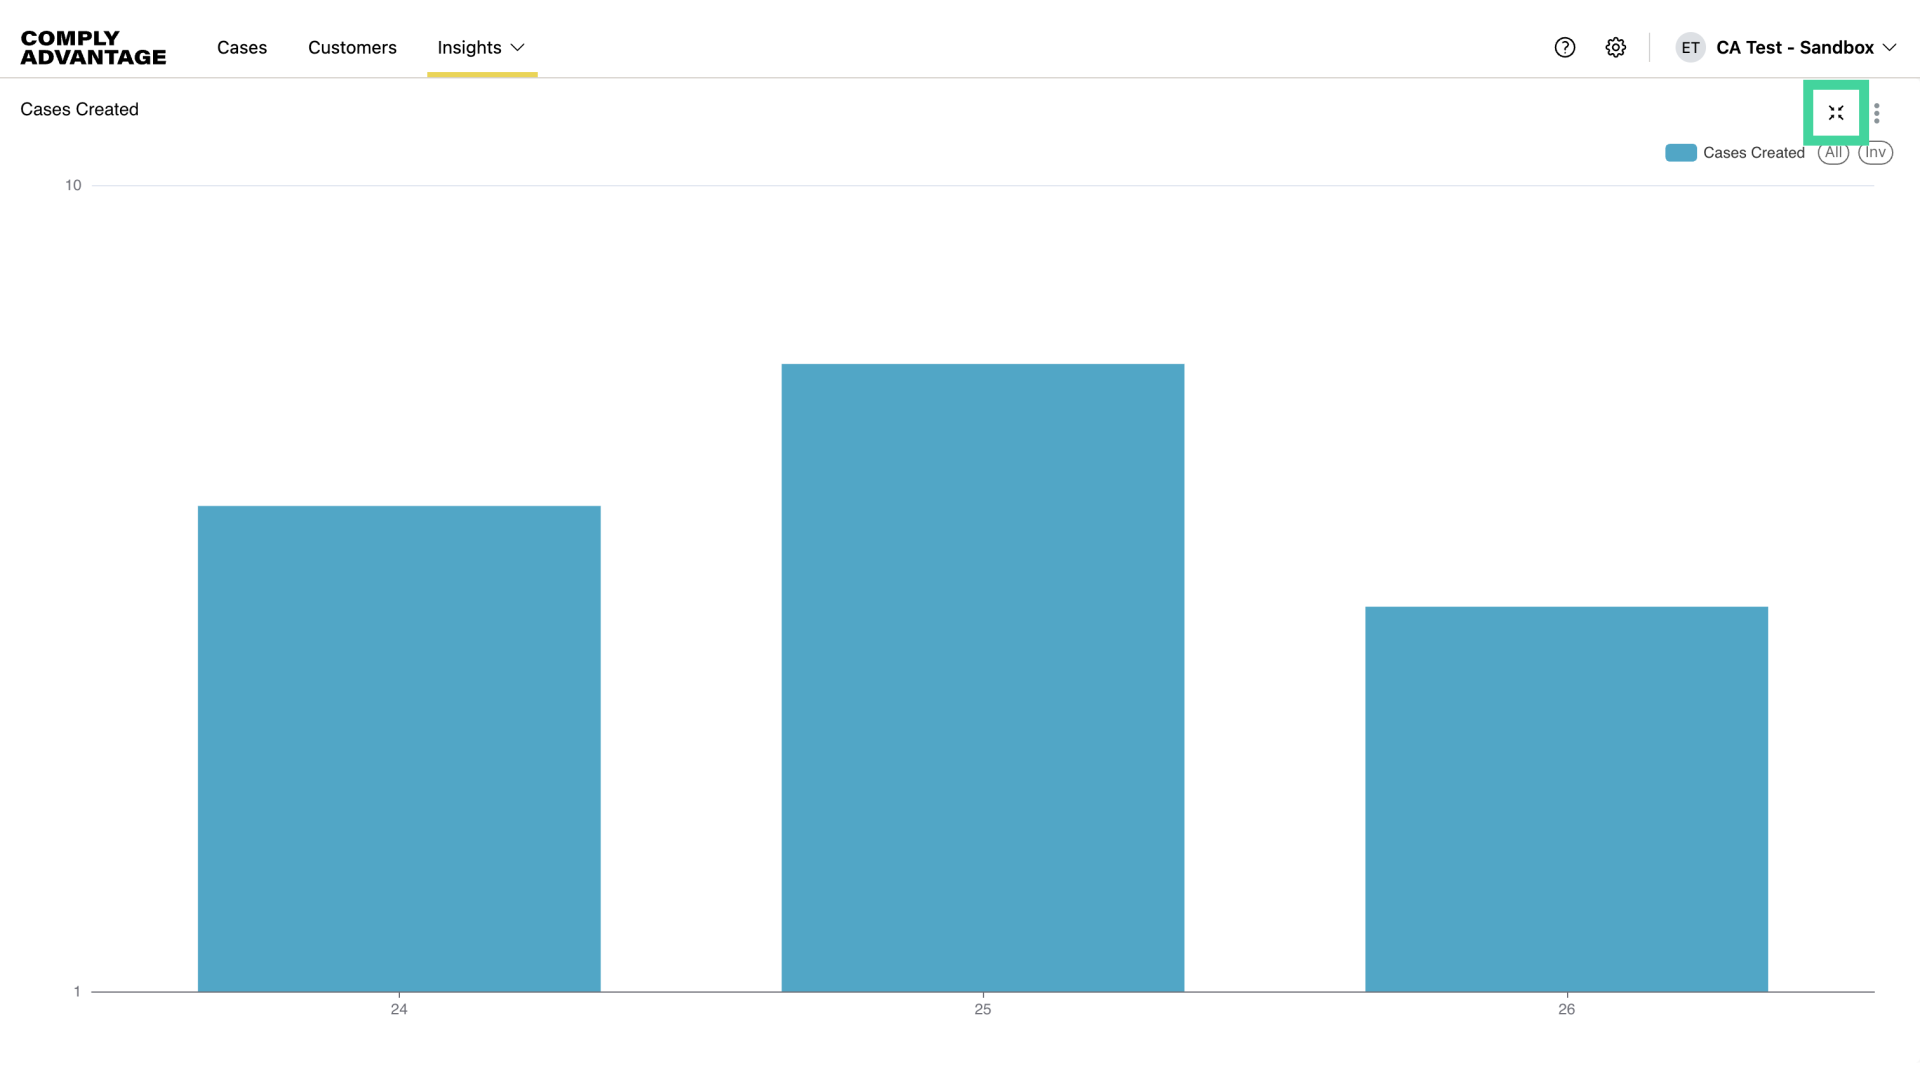
18. Exit full screen
To exit full-screen, click here.
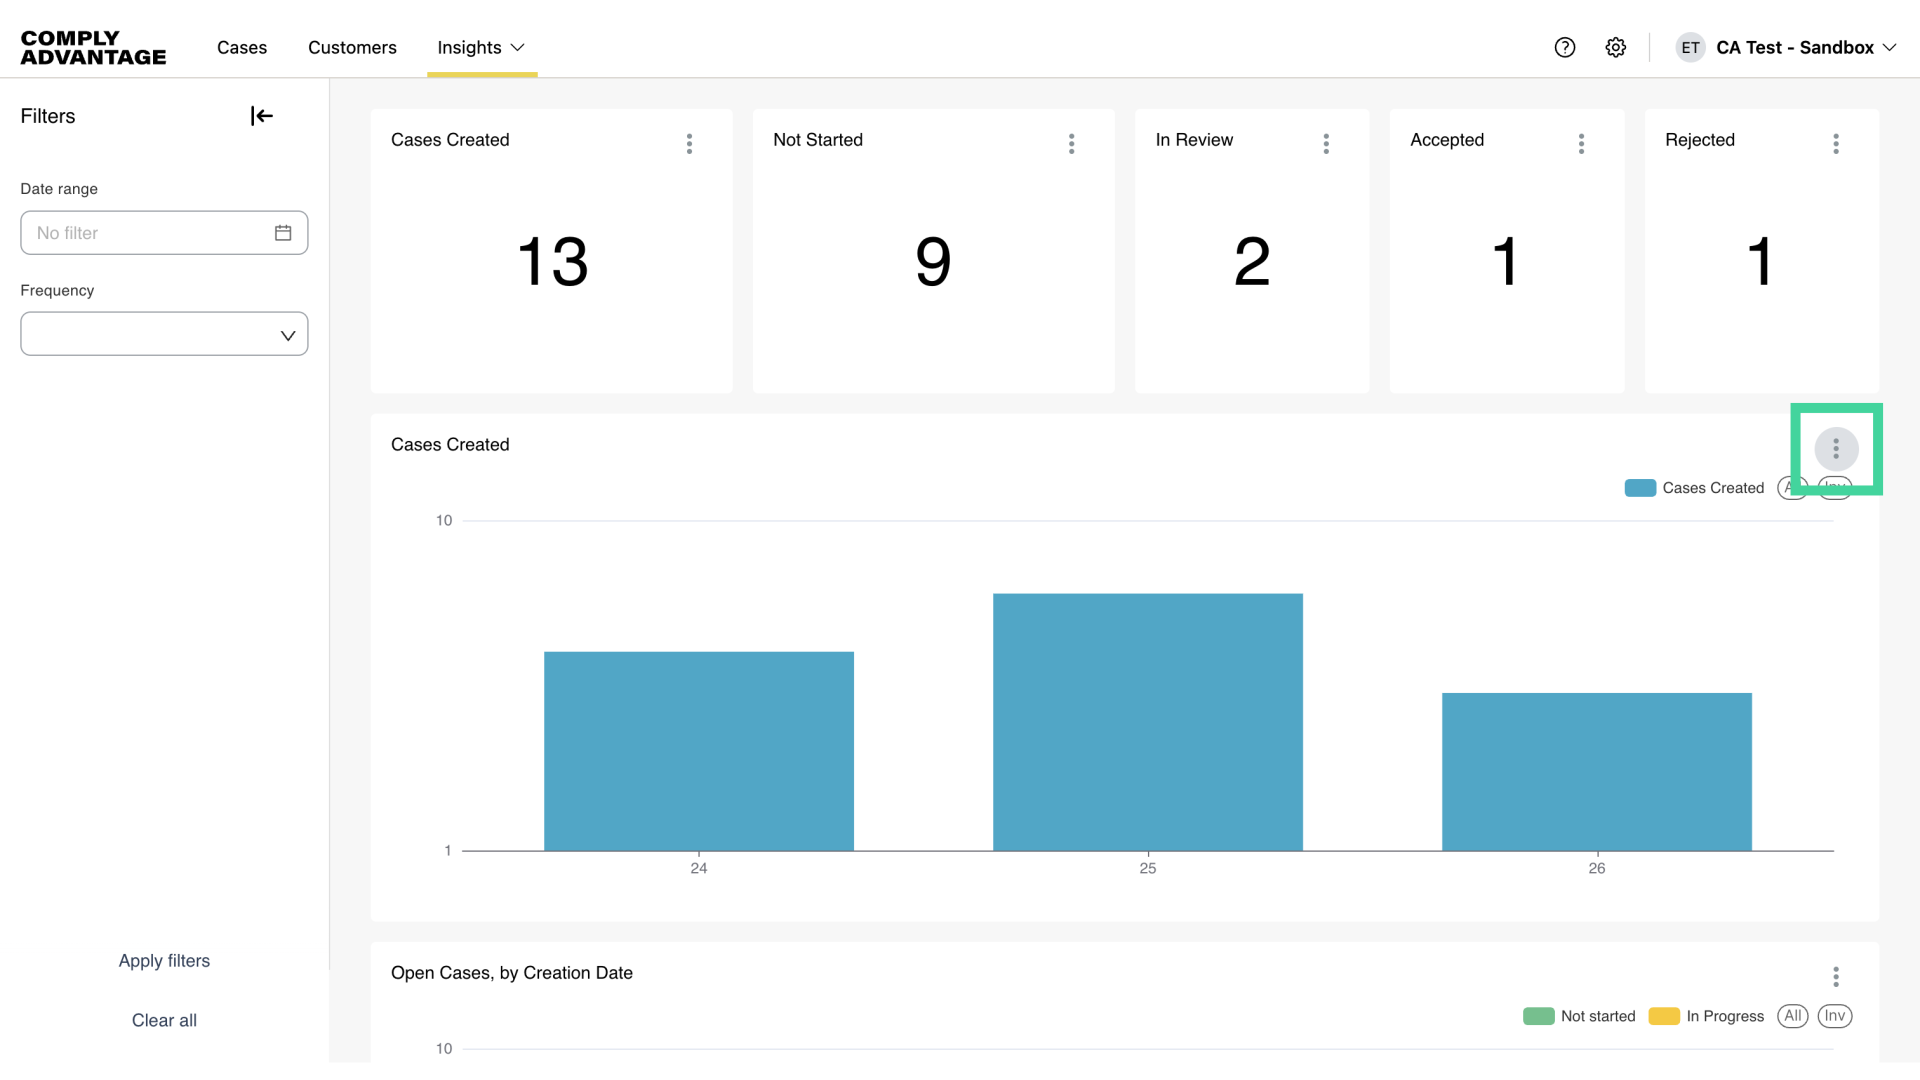
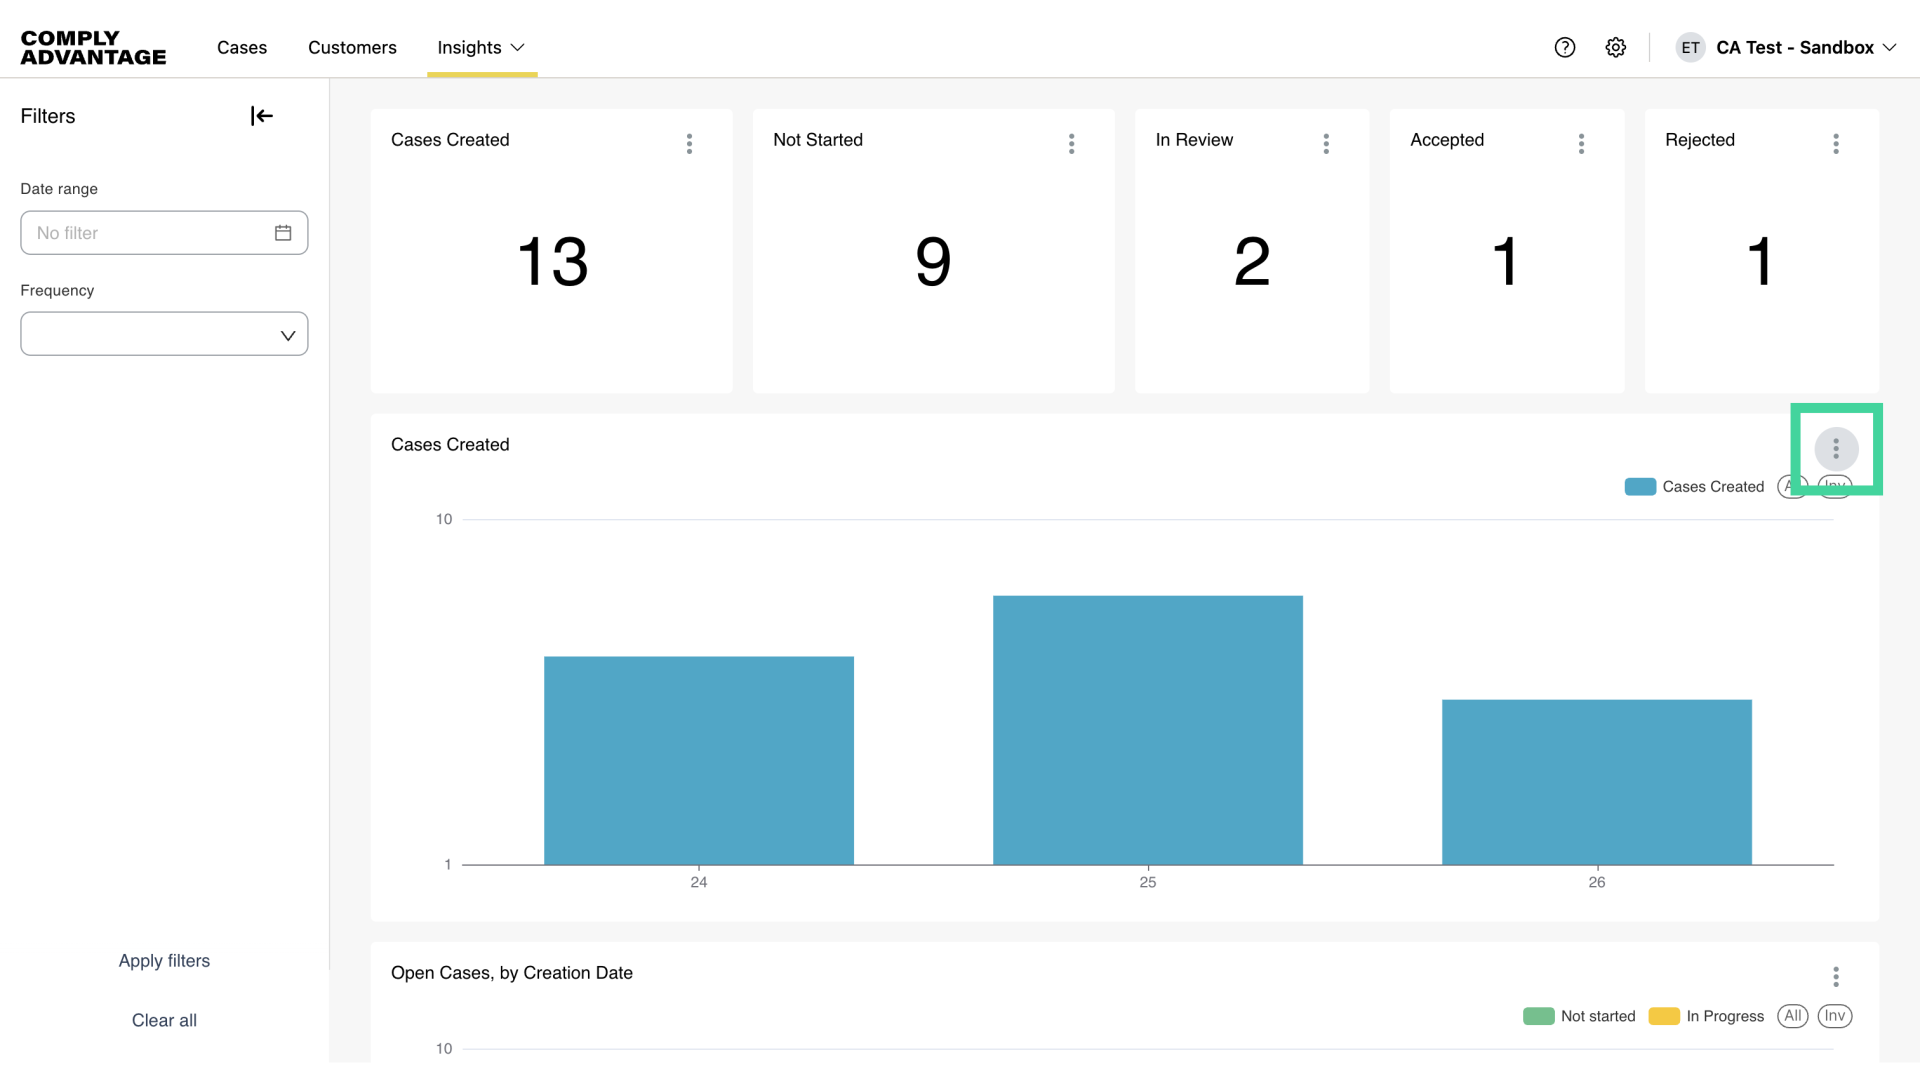
19. Download insights
You can download insights data and images for a chart to use outside of Mesh. First, click these three vertical dots.
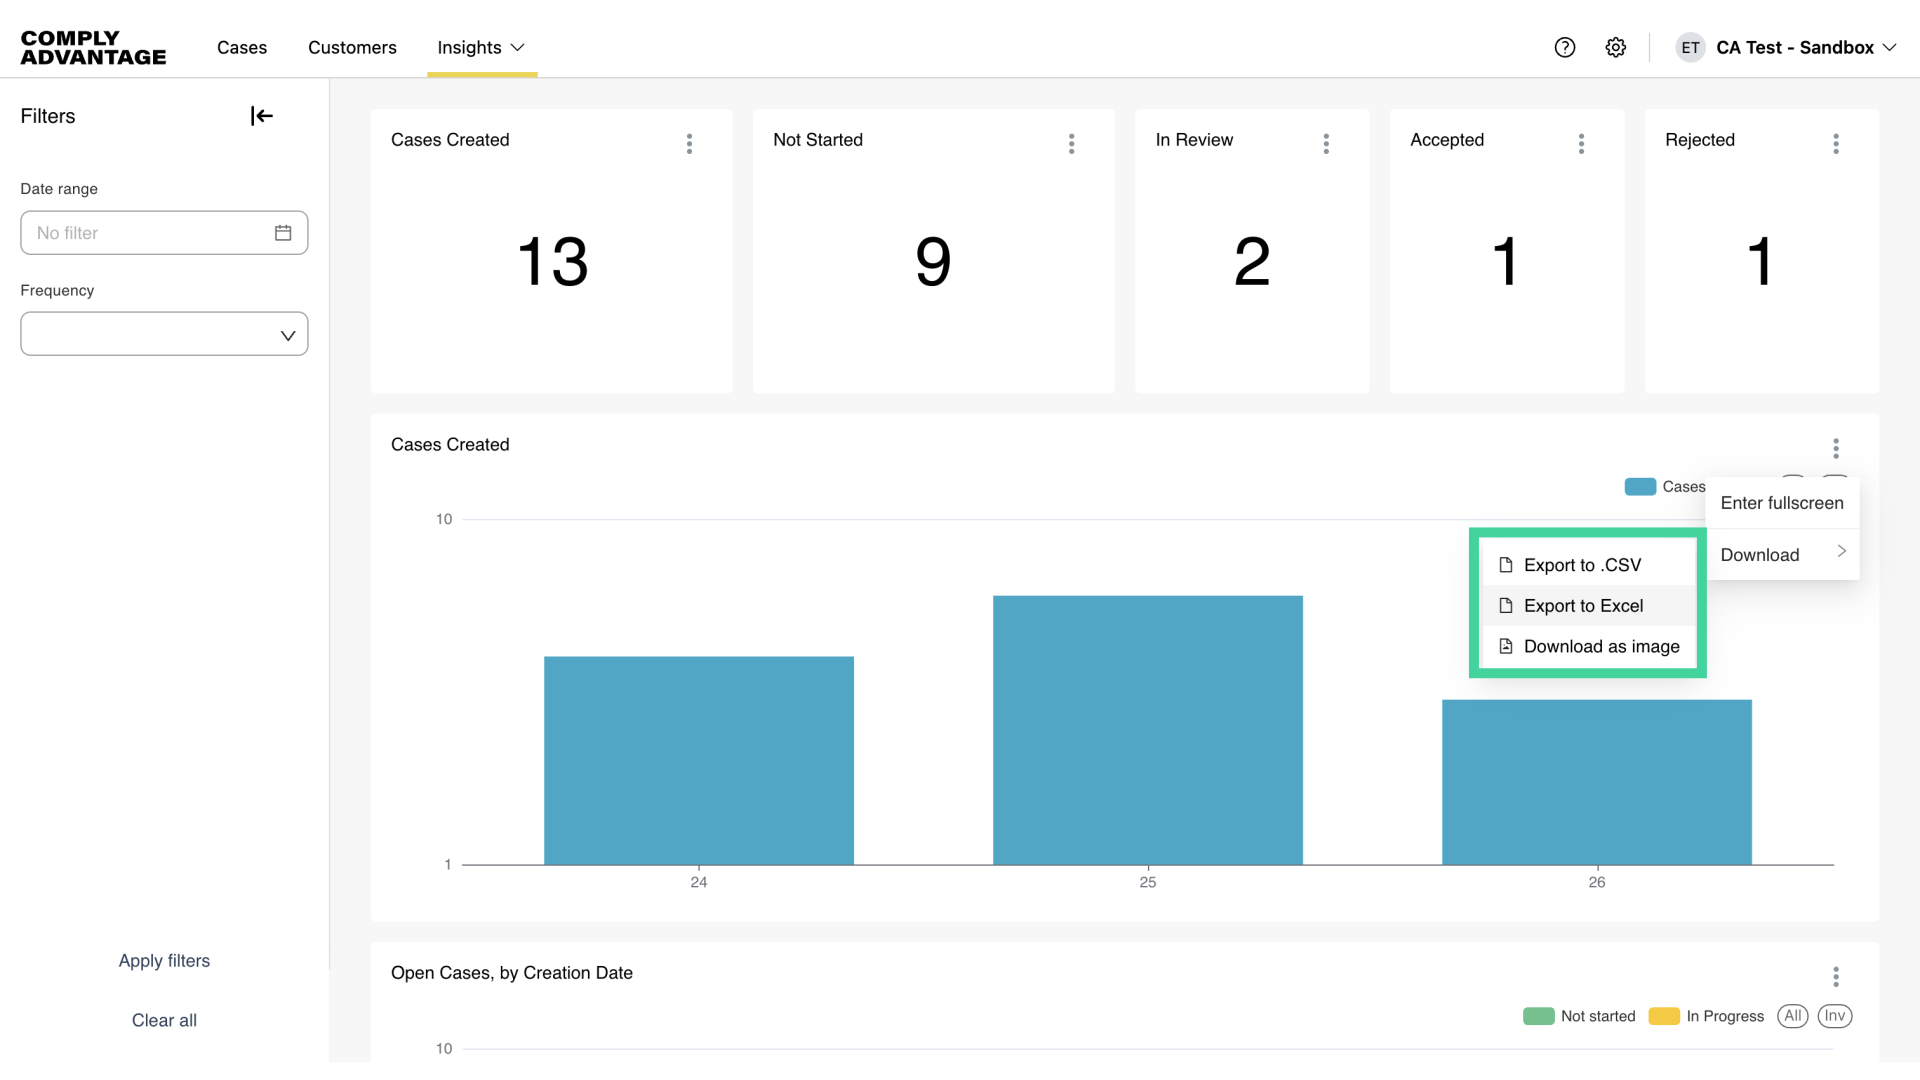
20. Select the relevant download option
Then, click download and export using the appropriate option.
We hope this guide helped you learn to apply filters, export data, and navigate cases effectively for enhanced reporting capabilities.