View customer monitoring insights
Last updated: April 7, 2026
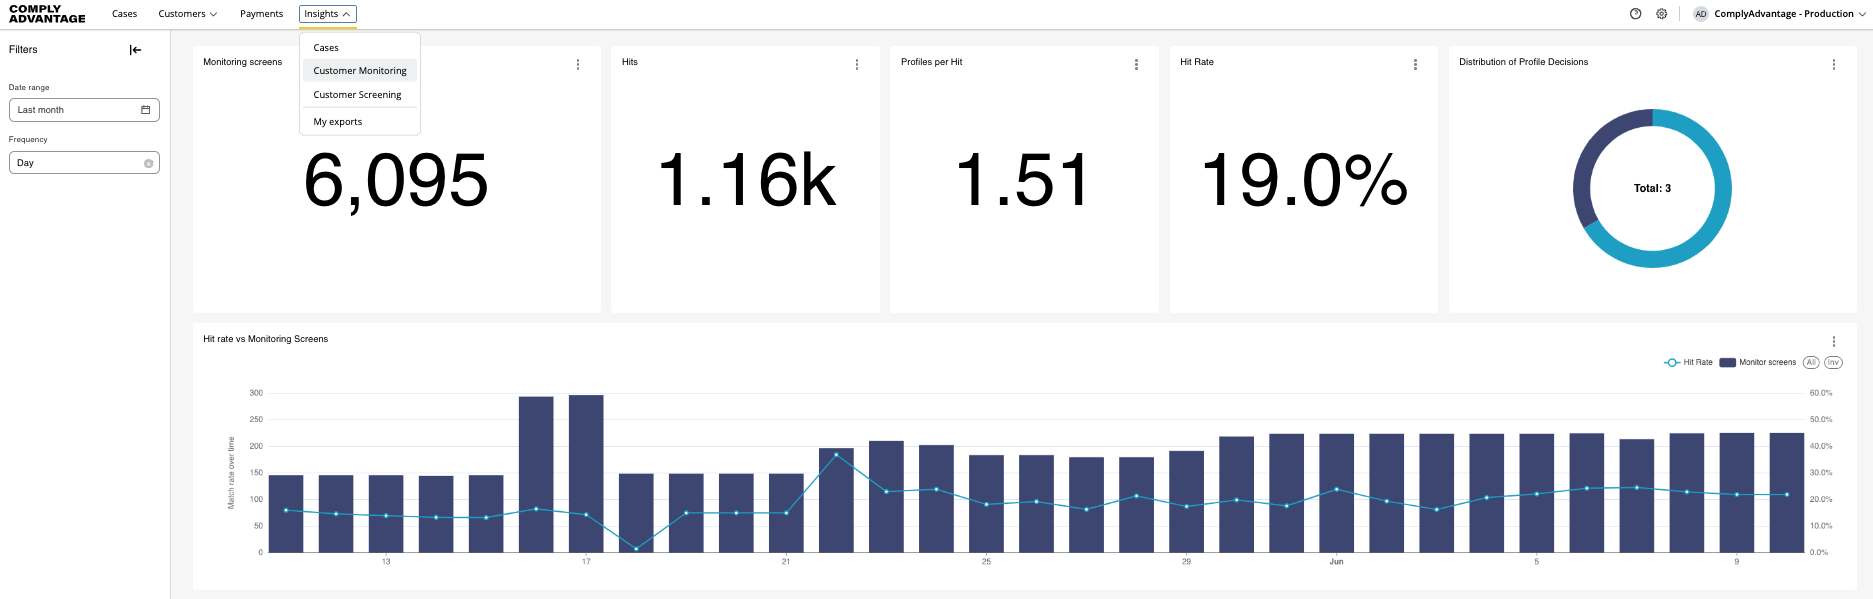
Navigate to the client's insights page via the tab Insights and click Customer Monitoring.
The customer monitoring dashboard has 2 sections:
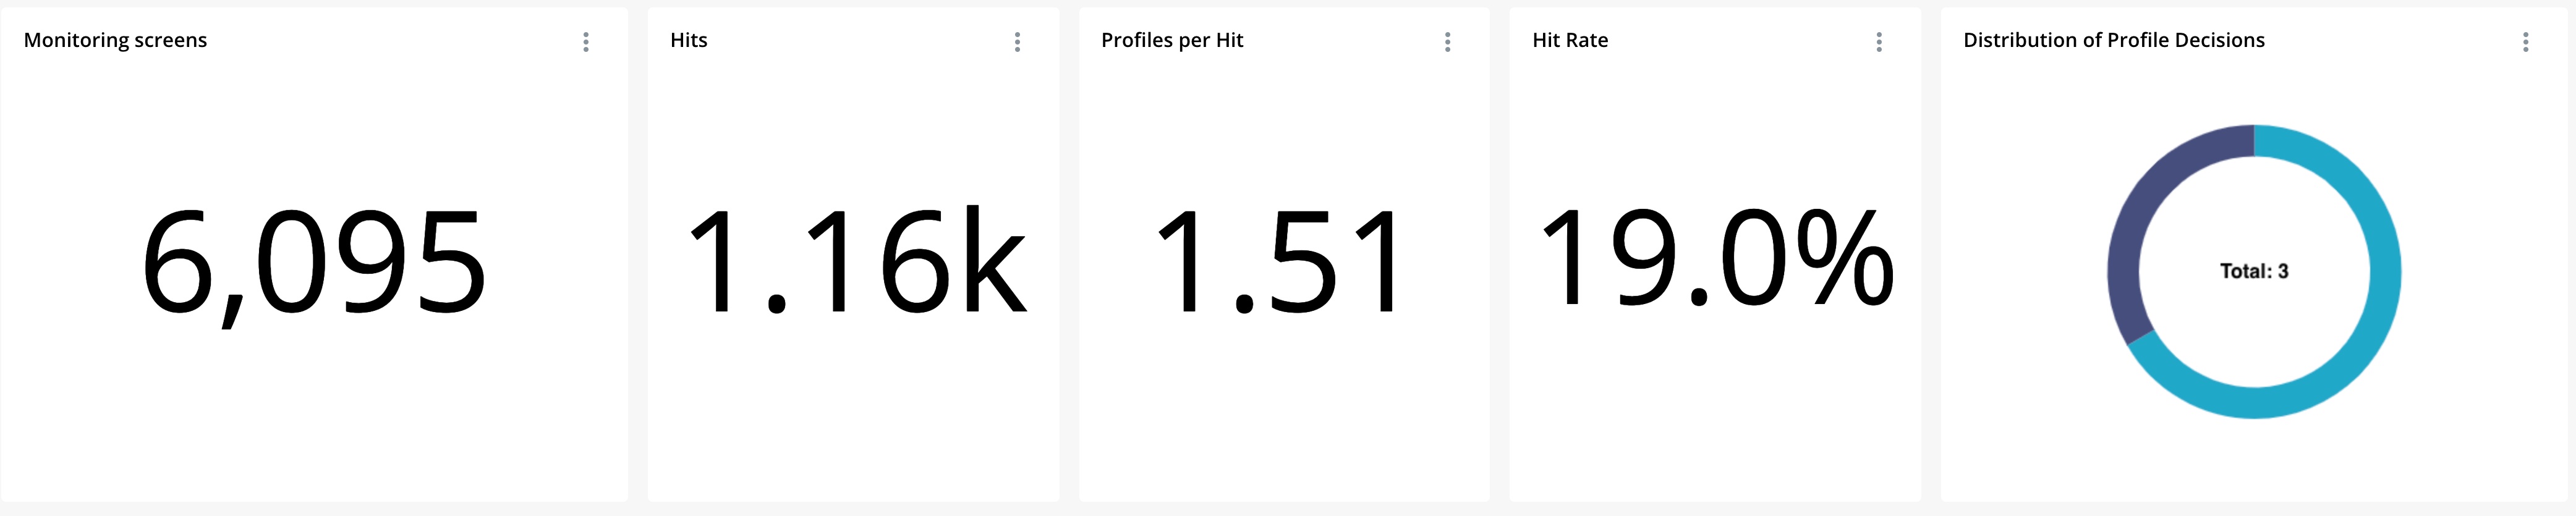
Headline totals
Charts
Headline totals
The top of the Customer Monitoring dashboard highlights key data points for a default date range of the last 30 days. The headline metrics include:
Monitoring screens: The number of times monitored customers were re-screened during this period.
Hits: The proportion of monitored customers that returned profiles during monitoring.
Profiles per hit: The average number of profiles per hit.
Hit rate: The proportion of customers monitored that had a hit, shown as a percentage.
Distribution of profile decisions: The proportion of true positive vs. false positive matches as a percentage.
Charts
The Customer Monitoring dashboard provides several insights into the performance of your monitoring program.
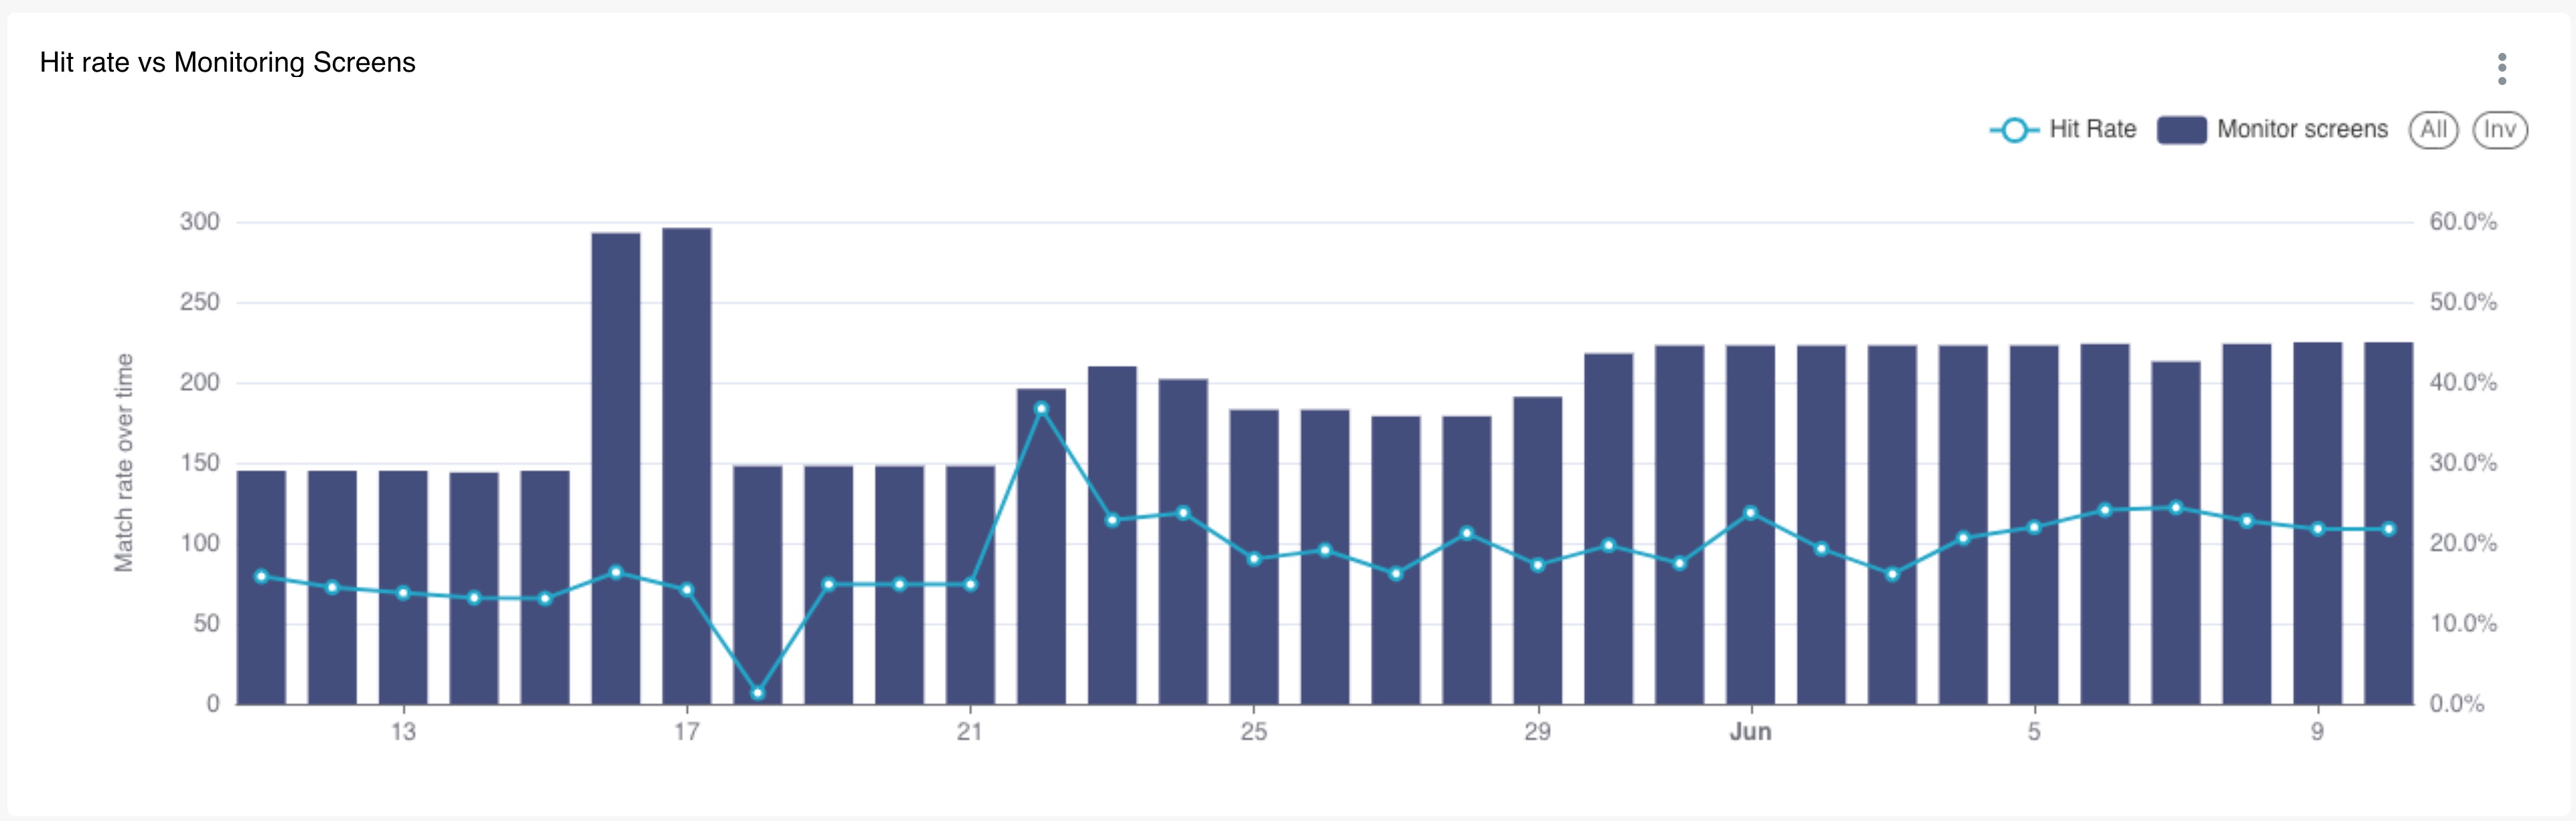
Hit rate vs. number of monitoring screens
This chart shows the number of customers monitored for a given period and the average hit rate across all the monitoring screens. The default date range is the last 30 days, and the default frequency is daily.
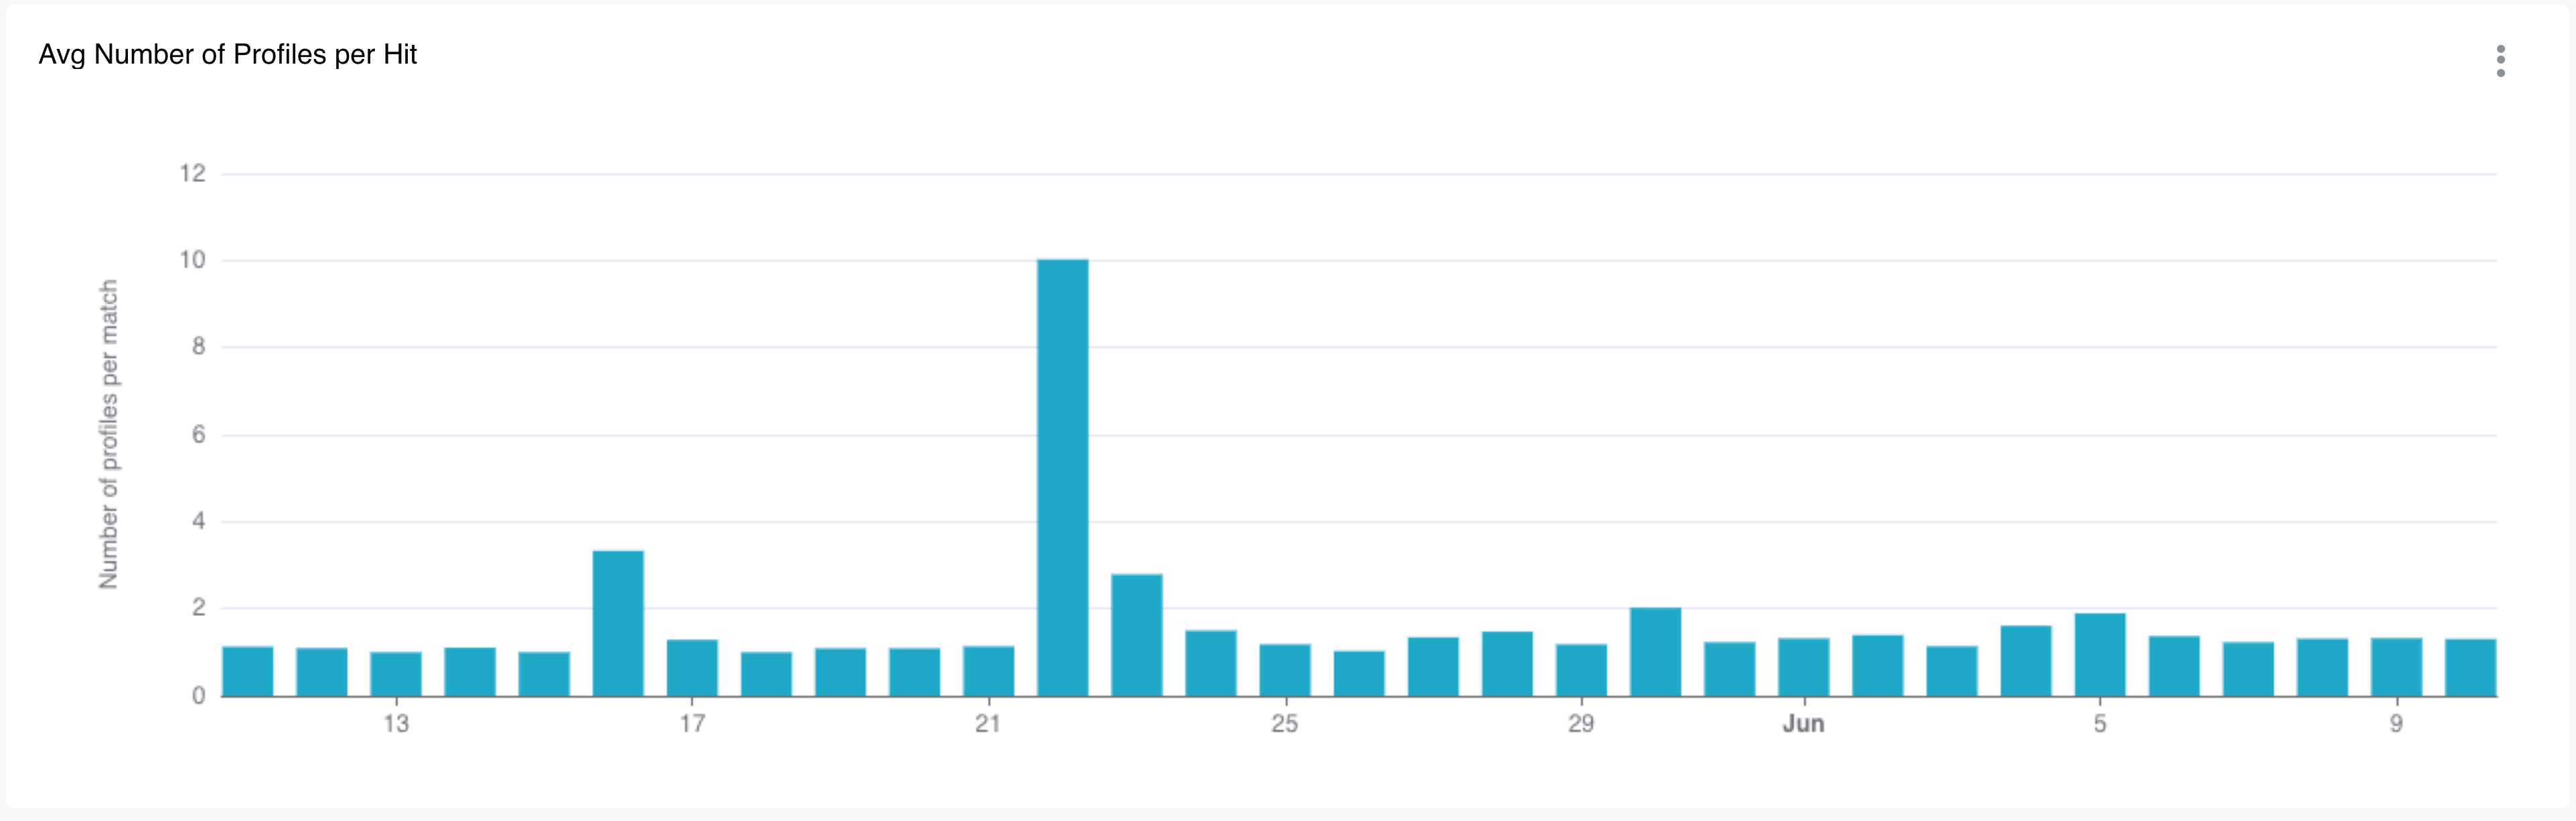
Average number of profiles per hit
This chart shows the average number of profiles returned for hits within a given period of time. The default date range is the last 30 days, and the default frequency is daily. This can be useful to understand if you’re getting too many (or too few) profiles returned each time there is a hit and if any adjustments need to be made to monitoring settings.